Are Solar Panels Worth It in 2026? Cost, Payback & Decision Guide
Solar panel costs fell again in 2024 thanks to record-low module prices, even as installed costs varied by market. Whether solar panels are worth it in 2026 comes down to your electricity rate, sun exposure, system price, and incentives. For many homeowners paying 15–30¢/kWh and with a sun‑friendly roof, solar produces double‑digit returns and 6–10 year paybacks; for others with shaded roofs or very low utility rates, the math is tougher.
This guide shows you how to evaluate your home using current prices, incentives, and a step‑by‑step payback method you can apply in minutes.
Quick answer — are solar panels worth it?
Short verdict: Yes, for most homeowners with good sun, retail electricity ≥15¢/kWh, and access to the 30% U.S. federal tax credit (or equivalent incentives abroad), rooftop solar in 2026 typically pays back in 6–10 years and delivers 8–15% annualized returns over 25 years. Solar is especially compelling if:
- Your electric rate is high (California, Northeast U.S., parts of EU/UK) or on a rising tariff
- Your roof is unshaded, south/southwest facing, and you use ≥8,000 kWh/year
- You can claim incentives (U.S. 30% ITC; UK 0% VAT + SEG payments; strong EU self‑consumption/export schemes)
- You’re electrifying loads (EV, heat pump), which increases solar self‑consumption
Solar may be less attractive if your roof is heavily shaded, your retail rates are under ~12¢/kWh, export credits are very low, or you plan to move in 1–3 years.
By the numbers: a 2026 snapshot
- Module prices collapsed in 2023–2024 on global oversupply. IEA and industry trackers reported crystalline silicon module average selling prices below $0.20/W by late 2024, a multi‑year low.
- Installed residential PV costs in the U.S. span roughly $2.30–$4.00/Wdc in 2026 depending on market and equipment, based on NREL cost benchmarks (2023–2024) and observed marketplace quotes in 2024–2025.
- The U.S. Energy Information Administration (EIA) put the average U.S. residential retail electricity price at ~16–17¢/kWh in 2024, with many states >25¢/kWh.
- Typical U.S. rooftop solar production: 1,100–1,700 kWh per kWdc per year, depending on location and shading (NREL PVWatts).
- Residential additions hit record levels in 2023 (SEIA/Wood Mackenzie), reflecting strong consumer economics despite policy changes in some states.
Solar Electricity Handbook - 2023 Edition: A simple, practical guide to solar energy – designing and installing solar photovoltaic systems: Boxwell, Michael
Solar Electricity Handbook - 2023 Edition: <strong>A simple, practical guide to solar energy – designing and installing solar photovoltaic systems</strong> [Boxwell, Michael] on Amazon.com. *FREE* shi
Check Price on AmazonCurrent costs and components — 2026 price ranges and regional variance
Understanding where the money goes helps you compare quotes apples‑to‑apples.
- Panels (modules): $0.35–$0.70/W for Tier‑1 mono PERC/TopCon modules in residential volumes; premium/high‑efficiency panels cost more. While the global factory gate price dipped below $0.20/W in 2024, freight, distribution, and margins lift delivered prices.
- Inverters: $0.25–$0.40/W for string inverters with DC optimizers; $0.40–$0.70/W for microinverters. Micros can boost production on complex or shaded roofs but add cost.
- Balance of system (racking, wiring, monitoring): $0.30–$0.60/W depending on roof type (asphalt vs tile/metal), layout, and wind/snow load requirements.
- Labor and overhead (permits, design, sales, interconnection): $0.70–$1.40/W, with significant regional variation. High‑cost metros (coastal California, Northeast U.S.) often sit at the top of the range.
- Batteries (optional): $800–$1,300 per usable kWh installed in 2026 quotes. A 10–13.5 kWh unit typically prices at $9,000–$15,000 before incentives, depending on brand, backup capability, and labor.
All‑in before incentives, a typical 7 kWdc residential system in 2026 often falls between $16,000 and $26,000 ($2.30–$3.70/W). After a 30% tax credit, that net cost becomes ~$11,200–$18,200.
Regional variance matters:
- U.S. West Coast and Northeast: Higher labor, permitting, and interconnection costs push installed $/W up. Complex roofs (tile, steep pitch) add to racking and labor time.
- U.S. Sun Belt and Midwest: Greater installer competition and simpler roofs can bring quotes closer to $2.30–$3.00/W for mainstream equipment.
- Europe: Installed costs vary widely. Markets with zero‑VAT on PV (e.g., Germany for qualifying systems since 2023) and streamlined permitting often see strong value even with lower irradiance.
- UK: Typical 3–5 kWp systems commonly price in the £4,000–£8,000 range pre‑battery; 0% VAT on solar and many other energy‑saving materials helps.
For deeper price context and savings strategies, see our cost explainers:
- Solar Panel Cost Guide: How Much You'll Pay & How to Save
- How Much Do Solar Panels Cost in 2026? Average Prices & Savings
How to calculate payback, ROI, and break‑even
You can estimate your payback in minutes with five inputs: system size, specific yield, effective electric rate, net cost after incentives, and your self‑consumption/export mix.
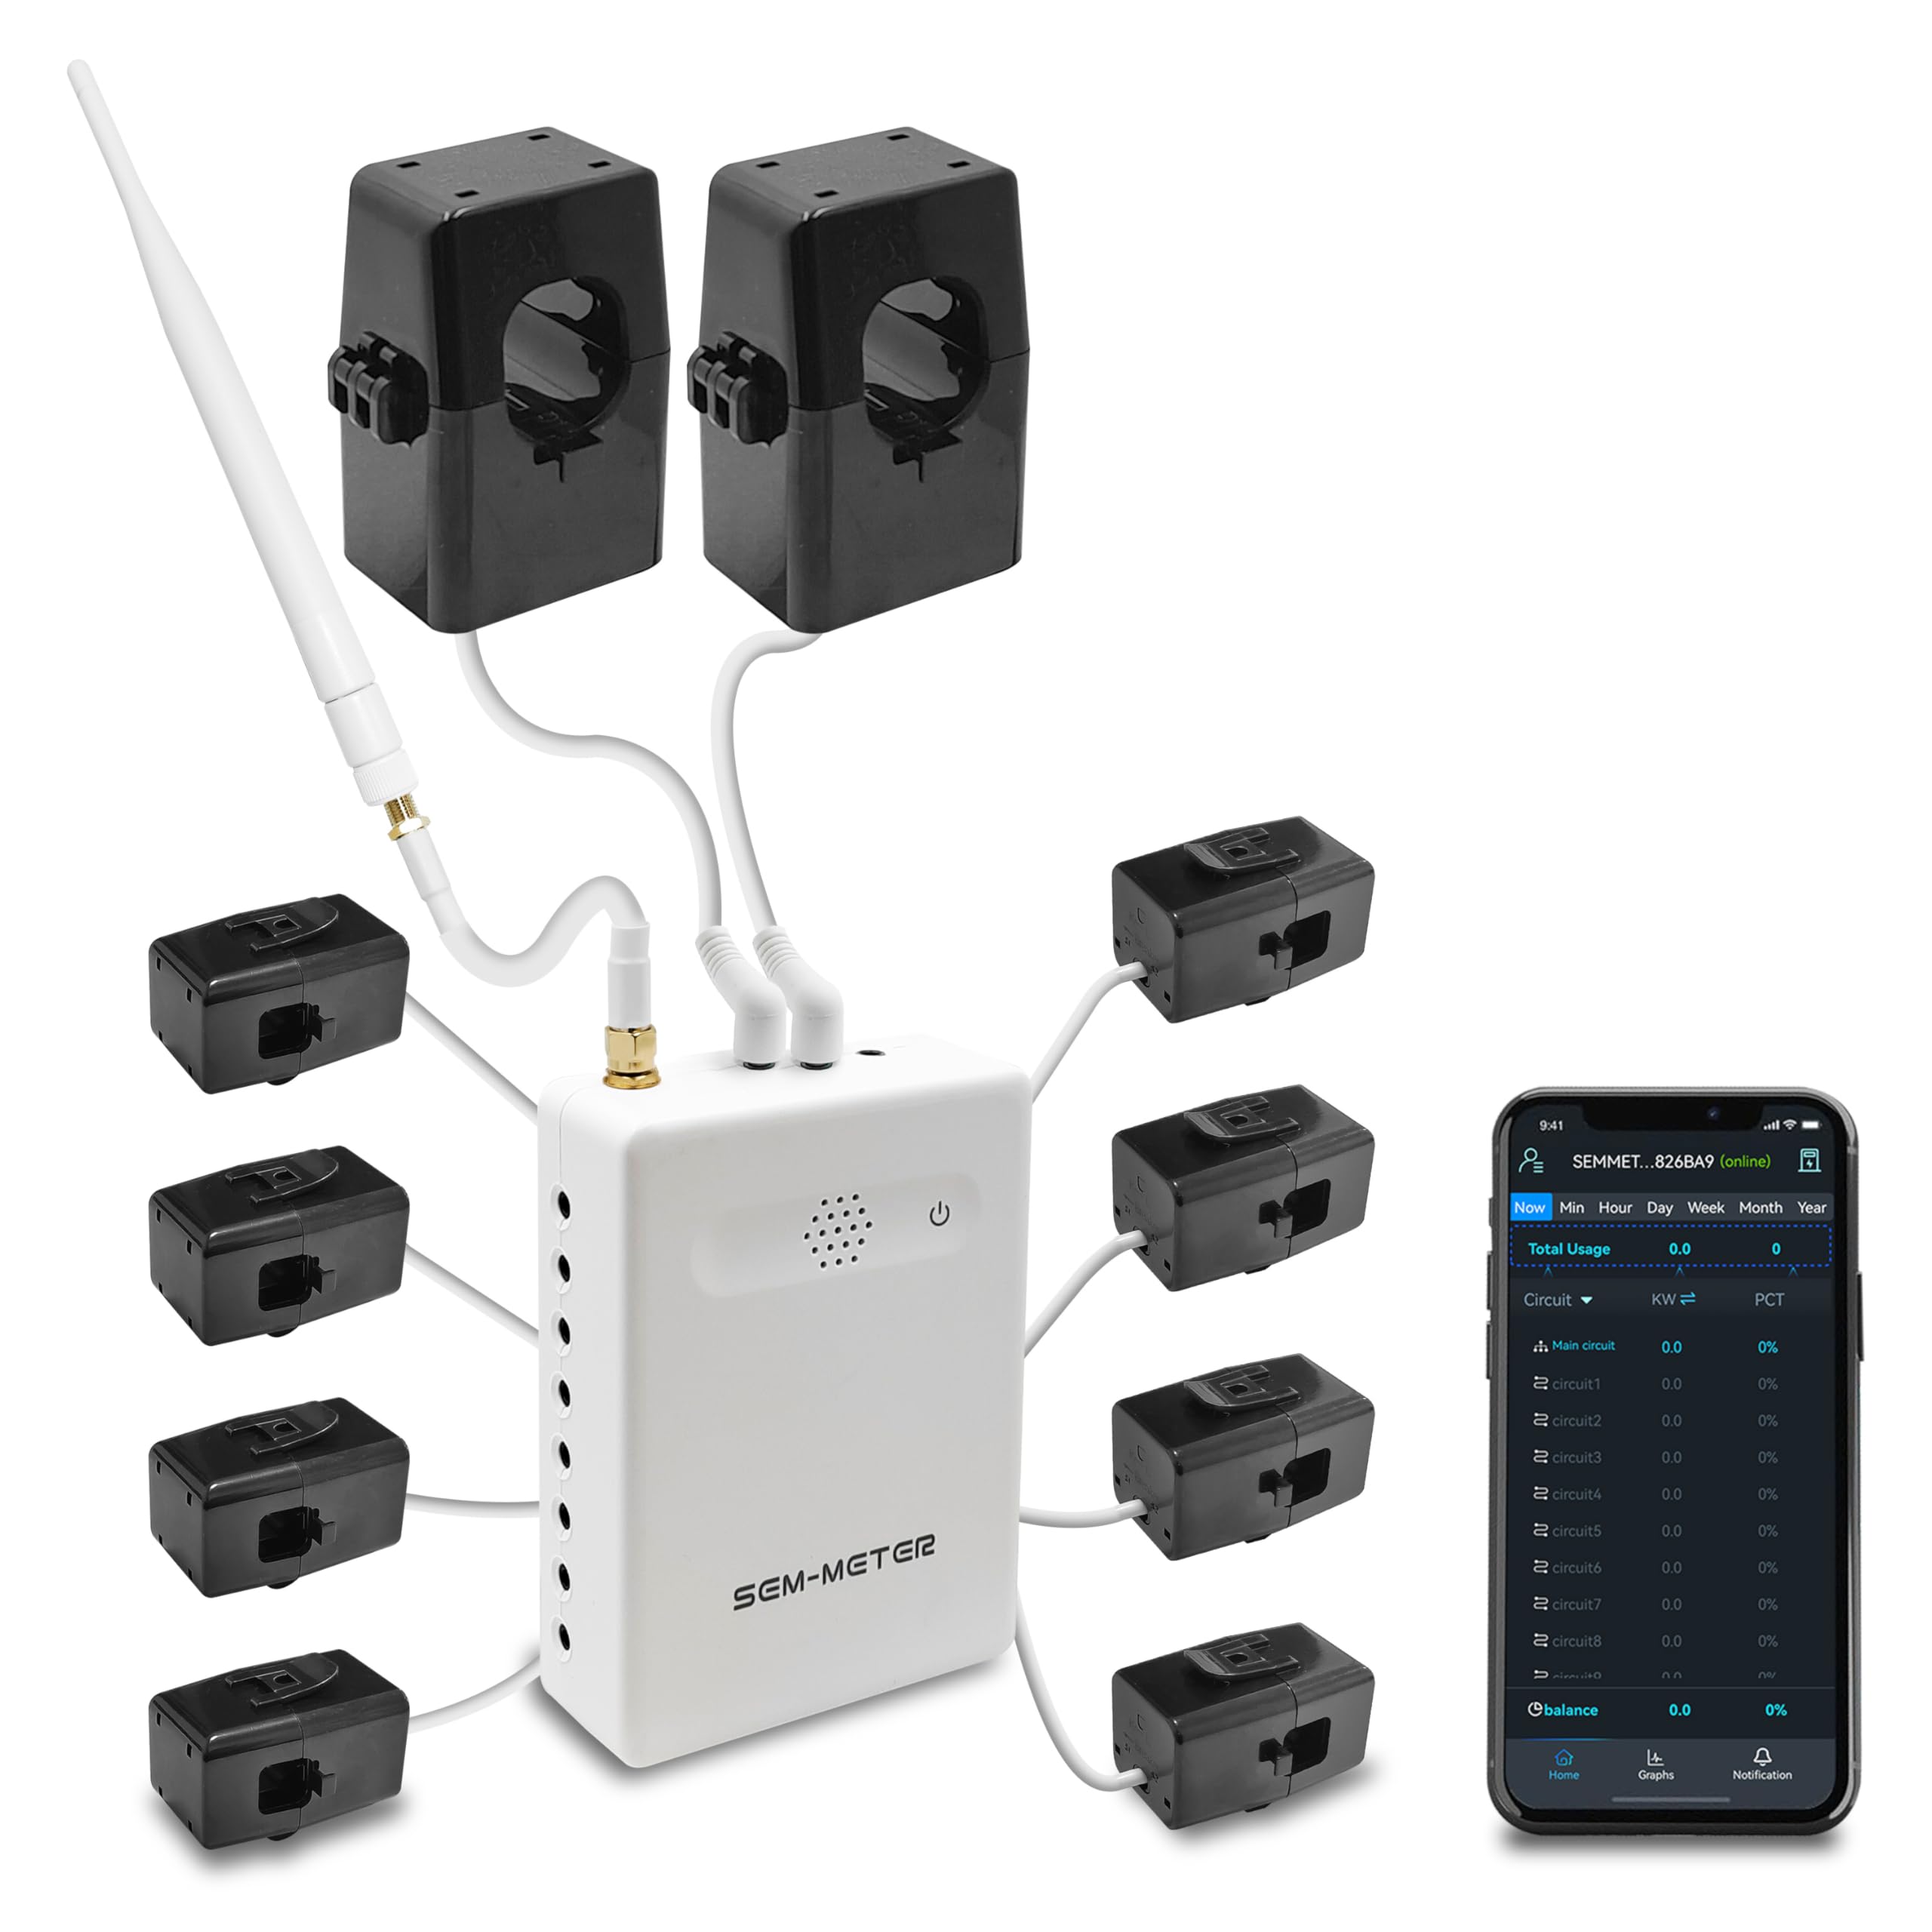
Smart Home Energy Monitor with 8 50A Circuit Level Sensors | Vue - Real Time Electricity Monitor/Meter | Solar/Net Metering - Amazon.com
View on AmazonKey definitions:
- Specific yield: Annual energy a PV system produces per kWdc installed (kWh/kW‑year). In the U.S., 1,100–1,700 is common. Use NREL’s PVWatts for your roof tilt, azimuth, and shading.
- Payback period: Net system cost divided by first‑year bill savings.
- ROI/IRR: Financial return. A simple ROI ignores time value; IRR accounts for timing of cash flows and degradation.
Step‑by‑step example (typical suburban home):
Size your system: Suppose 7 kWdc.
Estimate production: If your site has 1,400 kWh/kW‑year, production ≈ 7 × 1,400 = 9,800 kWh/year.
Determine your rate structure: Assume retail rate is 22¢/kWh. Exports credited at 10¢/kWh. You self‑consume 60% of generation and export 40%.
Calculate avoided cost: Savings = (self‑consumed kWh × retail rate) + (exported kWh × export credit).
- Self‑consumed: 9,800 × 0.60 = 5,880 kWh × $0.22 = $1,293.60
- Exported: 9,800 × 0.40 = 3,920 kWh × $0.10 = $392.00
- First‑year savings ≈ $1,685.60
Price your system: Quote is $3.10/W → 7,000 W × $3.10 = $21,700. Apply 30% tax credit (U.S.): net $15,190. Assume 0.5%/yr system degradation and 2%/yr utility price inflation.
Payback: $15,190 ÷ $1,685.60 ≈ 9.0 years (simple payback). With 2% annual bill inflation and modest degradation, modeled payback falls to roughly 8–9 years; lifetime IRR is typically 8–12%.
You can adjust two levers to accelerate payback:
- Increase self‑consumption (run dishwasher, laundry during sunny hours; charge EV midday; consider a small battery if export credits are very low).
- Reduce net cost (stack incentives, choose right‑sized equipment, compare multiple quotes).
Key factors that change the math
- Electricity rates: Higher retail prices shorten payback. The EIA reported ~16–17¢/kWh average U.S. residential rates in 2024; several states exceed 25–35¢/kWh. In the UK and parts of the EU, household tariffs spiked in recent years, strengthening solar’s value even with modest sun.
- Sunlight (irradiance): Specific yields range widely. Approximate annual yields (kWh/kW‑year) from NREL PVWatts for well‑sited roofs:
- Phoenix: ~1,700
- Miami: ~1,600
- Denver: ~1,500
- Boston: ~1,300
- Seattle: ~1,050 Shading, tilt, and azimuth can shift these values ±10–30%.
- System size and equipment: Oversizing beyond your usage can lower ROI if exports are credited below retail. Microinverters and optimizers often raise production on complex roofs, justifying added cost.
- Net metering and export rates: One‑to‑one net metering maximizes savings; time‑of‑use (TOU) rates and reduced export credits extend payback unless you shift loads or add storage.
- Financing terms: Low‑APR loans can preserve cash and keep payback similar to cash purchases. Beware “no‑fee/low‑APR” loans with embedded dealer fees (often 10–25% of project price) that lengthen payback substantially.
- Roof condition: If your roof needs replacement within 5–10 years, coordinate reroofing with solar to avoid future removal/reinstall costs. Some installers discount reroof + solar bundles.
- Interconnection and permitting: Queue backlogs and permitting delays can affect project timelines and, in some markets, tariff eligibility windows.
Incentives, rebates, and tax credits that improve economics
United States
- Federal Investment Tax Credit (ITC): 30% through 2032 for residential solar and eligible batteries (standalone and solar‑charged), subject to tax liability. This is the single largest incentive for many households.
- State/utility rebates and performance incentives: Examples include Solar Renewable Energy Credits (SRECs) in select states, performance‑based incentives (e.g., Massachusetts SMART), and utility rebates. Availability and value vary; always check your state energy office and utility.
- Net metering/export policies: Critical to value. Some markets credit exports at or near retail; others pay fixed or time‑varying export rates below retail.
European Union (selected highlights)
- VAT reductions/exemptions: Several countries allow reduced or zero VAT for small PV systems (e.g., Germany instituted 0% VAT on qualifying residential PV and batteries starting 2023).
- Self‑consumption bonuses and feed‑in premiums: France provides a self‑consumption bonus and guaranteed buy‑back tariffs for surplus. Other EU members offer similar schemes under national transpositions of EU directives.
- Local/regional grants: Municipalities and regions often provide grants or low‑interest loans for PV and storage; check your country’s energy agency.
United Kingdom
- 0% VAT on solar and many energy‑saving materials (enacted in 2022; scheduled through 2027, subject to policy updates) reduces upfront cost.
- Smart Export Guarantee (SEG): Suppliers pay for exported electricity, typically a few to >15–20 p/kWh depending on provider and tariff.
- Home energy grants/loans: Scotland and some local authorities offer support that can be paired with PV.
Where to check locally
- U.S.: Database of State Incentives for Renewables & Efficiency (DSIRE), state energy offices, and your utility’s distributed generation page.
- EU/UK: National energy agencies, Ofgem (UK), and municipal programs.
Stacking incentives with smart design (e.g., orienting some panels west for TOU peak savings) often shifts marginal projects into the “worth it” column.
For foundational details on equipment choices and system types, see Solar Panels Explained: How They Work, Costs, and Installation Guide and Best Solar Panels 2026: Top Picks, Specs & Buying Guide.
Real‑world examples and case studies
Case 1: Small home, modest usage (4 kWdc)
- Location: Mid‑Atlantic U.S., mixed sun (specific yield ~1,250 kWh/kW‑year)
- Production: 4 × 1,250 = 5,000 kWh/year
- Retail rate: 18¢/kWh; export credit: 8¢/kWh; self‑consumption: 65%
- Savings: (3,250 × $0.18) + (1,750 × $0.08) = $585 + $140 = $725/year
- Cost: $3.20/W → $12,800; net after 30% ITC: $8,960
- Payback: $8,960 ÷ $725 ≈ 12.4 years
- Note: With TOU optimization (running hot water heat pump, laundry midday), self‑consumption could rise to 75%, cutting payback to ~11 years.
Case 2: Typical suburban family (7 kWdc)
- Location: Texas Sun Belt, good sun (~1,600 kWh/kW‑year)
- Production: 11,200 kWh/year
- Retail rate: 16¢/kWh flat; export credit via buyback plan: 12¢/kWh; self‑consumption: 55%
- Savings: (6,160 × $0.16) + (5,040 × $0.12) = $986 + $605 ≈ $1,591/year
- Cost: $2.60/W → $18,200; net after 30% ITC: $12,740
- Payback: ~$12,740 ÷ $1,591 ≈ 8.0 years; strong IRR due to high yield and competitive pricing.
Case 3: Apartment/condo resident
- Rooftop ownership/access is limited; individual PV is often impractical.
- Options: Community solar subscriptions (save 5–20% on electricity with no upfront cost), green power tariffs, and appliance‑level efficiency (LEDs, heat pump dryer) deliver reliable bill reductions.
- In some jurisdictions, building‑level solar with virtual net metering can allocate credits to units; HOA support and utility rules govern feasibility.
Case 4: EV owner, TOU rates (9 kWdc + 10 kWh battery)
- Location: California metro; NEM 3.0‑style export (low daytime export rates), specific yield ~1,450
- Production: 13,050 kWh/year; EV adds 3,000–4,000 kWh/year usage
- Tariff: TOU with peak >40¢/kWh and midday export often 5–10¢/kWh
- Strategy: Charge EV and run major loads 10 a.m.–3 p.m.; small battery shifts solar to evening peaks
- Result: Self‑consumption >70%; avoided costs dominate value. Despite higher system price (battery adds ~$11,000 pre‑incentives), whole‑system payback lands ~9–12 years given high peak prices and tax credits on both PV and battery.
These examples illustrate how export policy and load timing are just as important as sticker price.
When solar is not worth it — alternatives and timing considerations
Solar may not pencil out if:
- Your roof is heavily shaded or faces north/northeast with limited array space
- Retail electric rates are very low (<12¢/kWh) and exports are credited far below retail
- You rent or expect to move within 1–3 years, limiting time to realize savings
- Your roof needs replacement soon and you can’t coordinate projects cost‑effectively
- Interconnection caps or fees in your utility territory severely reduce export value
Alternatives and “wait‑and‑see” strategies:
- Community solar: Subscribe to a local solar farm and receive bill credits, typically 5–20% savings with no equipment on your home.
- Energy efficiency first: Weatherization, heat pump water heaters, smart thermostats, and LED retrofits often deliver 20–40% load reductions at low cost.
- Demand flexibility: Shift usage to sunny/midday hours; explore TOU plans.
- Green power/renewable energy tariffs: Support renewables while you assess rooftop options.
- Time the roof: If reroofing is on the horizon, pair it with solar to minimize mounting and labor duplication.
Next steps checklist & how to get quotes
What to gather before requesting quotes
- 12 months of electric bills (kWh/month and $), plus your tariff name
- Photos of your electrical service panel and main breaker rating (e.g., 125A/200A)
- Roof details: age, material (asphalt, tile, metal), recent repairs, known shading
- Electrification plans: EV, heat pumps, pool, or other new loads
What to ask installers
- System design: Proposed size (kWdc), expected first‑year production (kWh), specific yield, and shading losses
- Equipment: Panel brand/model and efficiency; inverter type (string + optimizers vs microinverters) and warranty terms
- Warranties and guarantees: Product, workmanship, roof penetration warranty; production guarantee if offered
- Interconnection and tariff: Net metering/export credit rate, TOU implications, meter upgrade costs, and any fees
- Structural and electrical: Roof attachment method, wind/snow load compliance, main panel upgrade needs, rapid shutdown compliance
- Permitting and timeline: Expected schedule from contract to PTO (permission to operate)
- Storage options: Battery sizing rationale, backup loads, incentives, and control strategy (self‑consumption vs TOU shifting)
- Financing: APR, term, total financed amount, and any dealer fees; request a cash price comparison to reveal embedded fees
How to compare quotes like a pro
- Normalize by $/Wdc and annual kWh: A fair comparison looks at both installed price per watt and expected first‑year production. Ask for the modeling files or screenshots.
- Validate production with PVWatts: Cross‑check the installer’s expected kWh with NREL PVWatts using your address, roof tilt/azimuth, and shading.
- Check dispersion: Lawrence Berkeley National Laboratory’s Tracking the Sun reports show wide price dispersion among installers in the same market. Getting 3+ quotes can reveal 15–25% savings potential.
Call‑to‑action: Comparing quotes from multiple vetted solar installers typically saves 15–25% on total system cost and helps you choose the right equipment mix. Use your 12‑month bill, roof details, and the checklist above to generate like‑for‑like proposals.
Decision checklist (green lights vs yellow flags)
Green lights:
- Retail rate ≥15¢/kWh or rising; decent export credits or strong self‑consumption potential
- Unshaded, south/southwest roof with at least 250–400 sq ft of usable area
- Ability to claim incentives (e.g., 30% ITC) and stable home ownership horizon (5–10+ years)
- Fair cash or low‑fee loan terms; competitive price ($2.30–$3.30/W for mainstream gear in many U.S. markets)
Yellow flags:
- Complex/shaded roofs; limited array area; aging roof
- Very low rates or punitive export tariffs; interconnection hurdles
- High‑fee dealer financing inflating project cost by 10–25%
Where the market is heading
- Equipment costs: Module prices remained low entering 2026 amid global oversupply; inverter and battery prices are easing as supply chains normalize.
- Policy: Export credit schemes are evolving. Markets with lower export rates favor self‑consumption, load shifting, and right‑sized batteries. Many governments continue to support residential PV through tax policy, VAT relief, and export guarantees.
- Grid value: As more homes add PV and storage, aggregated flexibility (virtual power plants) is paying homeowners for grid services. Expect more utilities to offer battery incentives and dynamic rates that can further enhance ROI.
For more context on pricing and choosing components, see:
- Solar Panel Cost Guide: How Much You'll Pay & How to Save
- How Much Do Solar Panels Cost in 2026? Average Prices & Savings
- Solar Panels Explained: How They Work, Costs, and Installation Guide
- Best Solar Panels 2026: Top Picks, Specs & Buying Guide
Final CTA: If your roof gets decent sun and your power costs 15¢/kWh or more, solar is likely worth a close look. Gather your last 12 months of bills, run a PVWatts estimate, and request at least three quotes using the checklist above. In most markets, that hour of prep can translate into thousands of dollars in lifetime savings and a faster payback.

EMPORIA Level 2 EV Charger w/ J1772 Charger, 48 amp ...
View on AmazonRecommended Products
Solar Electricity Handbook - 2023 Edition: A simple, practical guide to solar energy – designing and installing solar photovoltaic systems: Boxwell, Michael
Solar Electricity Handbook - 2023 Edition: <strong>A simple, practical guide to solar energy – designing and installing solar photovoltaic systems</strong> [Boxwell, Michael] on Amazon.com. *FREE* shi
Smart Home Energy Monitor with 8 50A Circuit Level Sensors | Vue - Real Time Electricity Monitor/Meter | Solar/Net Metering - Amazon.com
Lightweight commercial 3-phase option available as a separate bundle. APPLICATION MONITORING WITHOUT GUISEWORK <strong>Up to sixteen (16) 50A sensors to accurately monitor your air conditioner, oven,
EMPORIA Level 2 EV Charger w/ J1772 Charger, 48 amp ...
Explore a wide selection of hardwired Level 2 EV charging stations. Features include 25-foot cables, app control, and weather-resistant construction.