Renewable Energy Trends 2023: Deployment, Tech Breakthroughs, Policy Shifts and Market Risks
2023 was a hinge year for clean power. Global renewable electricity capacity additions surged by roughly 50% year over year to around 510 GW, according to the International Energy Agency (IEA), with about three‑quarters of that from solar PV. At the same time, solar module spot prices fell by about 50% as new manufacturing capacity—especially in China—flooded the market (BloombergNEF). Battery pack prices resumed their long‑term decline to an average $139/kWh (BNEF), and grid‑scale storage deployments doubled. This data-rich snapshot of renewable energy trends 2023 explains what changed, why it matters, and where policy and markets are heading next.
For readers new to the technology landscape, see our overview of core options in Renewable Energy Sources: A Clear Guide to Solar, Wind & More (/renewable-energy/renewable-energy-sources-guide).
Renewable energy trends 2023: global deployment and market performance
The installation pace in 2023 was unprecedented. The IEA estimates the world connected about 510 GW of new renewable power, led overwhelmingly by utility‑scale and distributed solar. Wind installations also rebounded in several markets but faced pockets of cost inflation and permitting delays.

Power after Carbon: Building a Clean, Resilient Grid: Fox-Penner, Peter
In Power after Carbon, Peter Fox-Penner tackles the many thorny questions that arise, presenting a vision for how change is possible, if we rise to the occasion.”―Jeremy Grantham, Cofounder and Chief
Check Price on Amazon- Global generation mix: Renewables supplied about 30% of global electricity in 2023, with wind and solar together reaching 14.3% (Ember’s Global Electricity Review 2024). Low‑carbon sources (renewables plus nuclear) provided roughly 39%.
- China’s outlier year: China’s National Energy Administration reported a record 216–217 GW of new solar PV and about 76 GW of wind in 2023—more solar capacity than the entire world added in 2022. China accounted for roughly half of all global renewable additions (IEA).
- United States: The U.S. installed a record 32.4 GWdc of solar PV in 2023 (SEIA/Wood Mackenzie), while new wind capacity underperformed earlier expectations due to supply and interconnection headwinds. Grid‑scale batteries set records as interconnection reforms and the Inflation Reduction Act (IRA) tax credits took hold.
- European Union: The EU added on the order of 56 GW of solar (SolarPower Europe) and about 16 GW of wind (WindEurope). Drought‑related hydro shortfalls tightened markets in parts of Europe, highlighting the importance of diversification and storage.
- India: India added more than 12 GW of solar and several gigawatts of wind as it pursued its 2030 target of 500 GW of non‑fossil capacity, supported by domestic manufacturing incentives and large utility procurements (MNRE, India).
Short‑term demand drivers included high natural gas price volatility lingering from 2022, rapid adoption of heat pumps and EVs in some regions, and post‑pandemic electricity demand recovery in emerging Asia. These pushed utilities and corporates toward long‑term hedges via PPAs and accelerated distributed generation in high‑tariff markets.
Implications for 2030 targets: At COP28, countries endorsed tripling global renewable power capacity by 2030. Hitting that trajectory requires annual additions to rise from ~510 GW in 2023 to roughly 1,000+ GW per year by the late 2020s (IEA). With module prices falling and storage scaling, the supply‑side looks attainable—if grid, permitting, and financing bottlenecks are addressed.
By the numbers: 2023 at a glance
- ~510 GW renewable capacity added worldwide; ~75% solar PV (IEA)
- 216–217 GW solar and ~76 GW wind added in China (NEA)
- 32.4 GWdc U.S. solar installed (SEIA/Wood Mackenzie)
- ~56 GW solar and ~16 GW wind added in the EU (SolarPower Europe, WindEurope)
- Renewables ~30% of global electricity; wind+solar 14.3% (Ember)
- Solar module spot prices down ~50% year over year (BNEF)
- Lithium‑ion battery pack prices averaged $139/kWh (−14% YoY) (BNEF)
- Grid‑scale energy storage additions ~44 GW/97 GWh globally (BNEF)
- Corporate clean energy PPAs near record, ≈35–40 GW (BNEF)
- Energy transition investment ≈$1.7–$1.8 trillion (BNEF; IEA)
Technology and cost trends: solar, wind, storage, and hydrogen
Solar PV: price plunge plus tandem cell progress
- Costs: Crystalline silicon module spot prices fell to the $0.14–$0.16/W range by late 2023 as polysilicon prices tumbled and new capacity came online (BNEF). Balance‑of‑system costs were stickier due to labor and financing, but total installed costs dropped in China, the Middle East, and parts of Europe.
- LCOE: Lazard’s 2023 analysis put U.S. utility‑scale solar’s levelized cost of energy (LCOE) at roughly $24–$96/MWh, overlapping with gas combined cycle in many markets. Higher interest rates raised LCOE bands, but falling module prices offset some pressure.
- Technology: Perovskite‑silicon tandem cells set new records, with Oxford PV’s 28–29% efficiency certified and multiple labs surpassing 30% on small‑area cells (NREL records database). 2023 progress focused on stability and scalable deposition techniques—critical steps toward bankable modules later in the decade.
Wind: scaling turbines, floating steps forward, and cost headwinds
- Turbine scale: Commercial turbines in the 14–15 MW class advanced, with Chinese OEMs announcing 16–18 MW prototypes for offshore. Larger rotors can lift capacity factors and push LCOE down over time.
- Floating offshore: Industrialization edged forward. Hywind Tampen (88 MW, Norway) moved toward full operation, and governments advanced frameworks for multi‑GW floating tenders in the UK and Japan—laying groundwork for cost declines via serial production.
- Costs and auctions: Offshore wind faced acute inflation and financing stress in 2023. The UK’s AR5 auction attracted no offshore wind bids due to low administered strike prices, while several U.S. projects were canceled or renegotiated as supply costs surged. These episodes exposed the sensitivity of capital‑intensive projects to interest rates and indexation. Onshore wind encountered siting and permitting friction in parts of Europe and the U.S., though Germany and others enacted speed‑up laws.
- LCOE: Lazard’s 2023 LCOE for onshore wind was roughly $24–$75/MWh; offshore remained higher but competitive with gas peakers in windy regions when factoring system value.
For a data‑driven comparison of these two workhorse technologies, see Is Wind Energy Better Than Solar? A Data-Driven Comparison (/renewable-energy/is-wind-energy-better-than-solar-comparison).
Batteries and long‑duration storage (LDS)
- Scale: Global energy storage deployments doubled to about 44 GW/97 GWh in 2023, led by the U.S. and China (BNEF). California’s net peak is now routinely supported by multi‑GW of batteries, and Europe added record residential storage alongside rooftop PV.
- Cost: Average lithium‑ion pack prices fell 14% to $139/kWh, reversing 2022’s spike (BNEF). Falling cathode and anode materials costs—especially lithium—drove declines.
- LDS: The U.S. Department of Energy selected 15 long‑duration storage demonstrations for up to $325 million in support (OCED, Oct 2023), spanning iron‑air, flow batteries, thermal, and compressed air. These pilots will inform cost/operability pathways beyond the 4–6 hour sweet spot of lithium‑ion.
Electrolyzers and green hydrogen
- Manufacturing: IEA’s Global Hydrogen Review 2023 estimates electrolyzer manufacturing capacity exceeded 20 GW per year, with China leading. Installed capacity remained in the 1–2 GW range, but the project pipeline for 2030 is multiples larger.
- Costs and policy: Delivered green hydrogen in 2023 typically cost $4–$8/kg depending on power prices and electrolyzer capex. U.S. Treasury’s draft guidance for the 45V hydrogen production tax credit (Dec 2023) proposed strict additionality, deliverability, and hourly matching—rules that, if finalized, would anchor emissions integrity but limit early volumes to the cheapest wind‑and‑solar regions.
Implications for the technology mix: The 2023 price collapse for PV modules and improving storage costs tilt near‑term buildout toward solar‑plus‑batteries across sunny grids, while wind retains an essential role in seasonal complementarity and capacity value, especially in high‑latitude markets. Hydrogen’s 2023 progress was foundational but not yet system‑scale; its most credible near‑term roles are in refining, ammonia, and selected industrial heat applications where firm low‑carbon fuels are necessary.
For adjacent breakthroughs across climate tech, see Green Tech Innovations: 10 Technologies Shaping a Sustainable Future (/ai-technology/green-tech-innovations-technologies-shaping-sustainable-future).
Policy, finance, and corporate commitments
- United States: The Inflation Reduction Act’s technology‑neutral, long‑dated tax credits (PTC/ITC) continued to rewire incentives. Key 2023 milestones included transferability markets maturing (lowering the cost of tax equity) and guidance on domestic content adder rules. Treasury’s 45V hydrogen guidance set the tone for high‑integrity green hydrogen. FERC Order 2023 reformed interconnection processes to reduce queue backlogs.
- European Union: The EU advanced the Net‑Zero Industry Act and electricity market design reform to stabilize investor expectations, alongside REPowerEU’s acceleration measures. The Carbon Border Adjustment Mechanism (CBAM) began its transitional reporting phase in October 2023, signaling long‑term carbon pricing externalities for imports.
- China and India: China sustained massive domestic deployment through provincial targets and grid buildout, while India’s production‑linked incentives (PLI) expanded domestic solar manufacturing and supported utility solar auctions.
- Corporate procurement: Despite price volatility, corporations signed near‑record volumes of renewable PPAs—on the order of 35–40 GW globally (BNEF)—as firms pursued RE100 targets and sought long‑term price hedges. Contract structures continued shifting toward hybrid solar‑plus‑storage, shaped by time‑of‑use tariffs and capture price risk.
- Capital flows: Global energy transition investment reached roughly $1.7–$1.8 trillion in 2023 (BNEF; IEA), with renewables and electrified transport dominating. The main headwind was the cost of capital: policy risk and interest rates raised weighted average cost of capital (WACC) by 200–300 basis points in some markets, disproportionately affecting large, long‑lead assets like offshore wind and transmission.
Investor risk/reward: 2023 clarified that merchant‑plus‑hedge and contracts with inflation indexation better weather macro shocks than fixed‑price CfDs without reopening provisions. For developers, supply chain diversification (both geographically and across technologies) became a core risk control strategy.
Grid integration, digitalization, and storage solutions
2023’s record build highlighted a new bottleneck: the grid itself. Transmission and distribution capacity, interconnection processes, and operational flexibility now determine how fast renewables can scale.

Emporia Vue 3 Home Energy Monitor - Smart Home Automation Module and Real Time Electricity Usage Monitor, Power Consumption Meter, Solar and Net Metering for UL Certified Safe Energy Monitoring - Amazon.com
View on Amazon- Interconnection queues: Lawrence Berkeley National Laboratory’s 2024 update found more than 2,600 GW of generation and storage waiting in U.S. queues at end‑2023, with median wait times exceeding five years.
- Transmission: Build rates lag far behind needs. Many regions require multi‑GW, multi‑state lines to tap the best wind and solar resources; permitting and cost allocation remain sticking points. Europe faces similar cross‑border congestion challenges.
- Distributed energy resources (DERs): Rooftop PV, behind‑the‑meter batteries, and flexible loads expanded rapidly in 2023. Germany and Italy set records for home storage attached to PV, enabling higher self‑consumption and local resilience.
- Flexibility and market design: As renewable penetration rises, capture prices for solar at midday and wind during storms can fall. 2023 saw growth in grid‑scale batteries, demand response, and virtual power plants (VPPs). Tariff reforms (time‑of‑use and real‑time pricing) and ancillary service markets improved monetization for fast‑responding assets.
- Vehicle‑to‑grid (V2G): Pilots expanded in the U.S., UK, and Japan, validating value streams for frequency response and peak shaving. Standardization and warranty frameworks still need work to scale.
- Digital and AI: Utilities and aggregators accelerated deployment of grid‑aware inverters, probabilistic forecasting, and AI‑assisted outage and congestion management to raise hosting capacity without immediate hardware upgrades. For a deeper dive on digital tools, see AI in Renewable Energy: Applications, Risks, and a Roadmap for Adoption (/sustainability-policy/ai-in-renewable-energy-applications-risks-roadmap).
The integration lesson from 2023 is clear: software‑enabled flexibility plus strategically targeted wires investments are as critical as adding nameplate megawatts.
Supply chain resilience and challenges
- Critical minerals: After the 2022 price spike, 2023 saw steep declines in lithium (spot carbonate down ~70–80% from peak), easing battery costs (IEA Critical Minerals Market Review 2024). Nickel supply surged from Indonesia, pressuring prices but raising ESG scrutiny. China’s late‑2023 export permit requirements on graphite highlighted concentration risks for battery anodes.
- Solar manufacturing: Massive Chinese expansions created a global module glut, lowering prices but stressing manufacturers elsewhere. U.S. and EU industrial policies sought to reshore parts of the value chain, but near‑term price competition remained fierce. Trade actions and forced‑labor compliance (e.g., U.S. Withhold Release Orders) continued to reshape sourcing.
- Wind supply chain: Turbine OEMs wrestled with input cost inflation, quality issues in new platforms, and thin margins. Several markets began revising auction designs to include inflation indexation and non‑price criteria to stabilize the sector.
- Recycling and second life: The EU’s 2023 Battery Regulation set recycled content targets and traceability requirements. PV module recycling capacity expanded, and blade recycling pilots progressed using mechanical and chemical routes. Stationary second‑life batteries from EVs gained traction in Europe and Japan, though bankability and warranty terms are evolving.
- Permitting and siting: Permitting timelines remain a top risk to 2030 targets. The U.S. enacted modest federal permitting streamlining in 2023, and Germany and Spain accelerated processes for wind and solar. Wildlife, community engagement, and grid constraints continue to drive project redesigns and delays.
Near‑term risks to deployment timelines include sustained high interest rates, interconnection backlogs, offshore wind cost blowouts in specific jurisdictions, and potential trade tensions over clean tech overcapacity.
Practical implications: what 2023 means for stakeholders
- Consumers and communities: Rooftop solar economics improved in many regions thanks to cheaper modules, though policy changes (e.g., net billing reforms) shift value toward self‑consumption plus batteries. Expect more community solar and aggregation models to unlock access for renters and multi‑family buildings.
- Businesses and institutional buyers: 2023 reinforced the value of diversified procurement—mixing utility PPAs, on‑site solar‑plus‑storage, and green tariffs. Time‑shaped or storage‑backed PPAs can mitigate capture price risk and align with 24/7 carbon‑free energy goals.
- Developers: Bankability favors projects with robust interconnection positions, index‑linked offtake, and supply chains diversified beyond single‑country dependencies. Co‑locating storage increasingly helps interconnection, curtailment, and revenue stacking.
- Policymakers and regulators: The scalability constraint has shifted from modules and turbines to wires and flexibility. Priorities for 2024–2026 include transmission siting reform, proactive grid planning, standardized interconnection milestones, and market designs that reward flexibility and capacity adequacy alongside clean MWh.
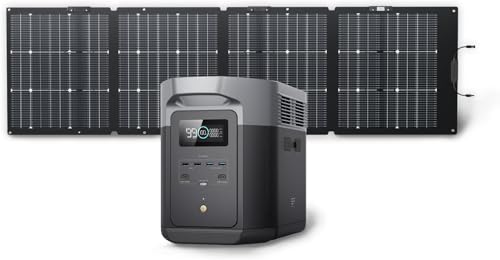
EF ECOFLOW Solar Generator DELTA 2 Max 2048Wh with 220W Solar Panel, LiFePO4 Battery Portable Power Station, Up to 3400W AC Output, AC + Solar Fast Dual Charging 0-100% in 1 Hr For Outdoor Camping RV : Patio, Lawn & Garden
View on AmazonWhere the trajectory is heading
The core storyline of renewable energy trends 2023 is acceleration with friction. Technology costs—especially for solar and batteries—moved decisively lower again, and global build rates set records. At the same time, the cost of capital and grid constraints reasserted themselves as the binding limits on growth, with offshore wind’s challenges the most visible example.
What to watch in 2024–2025:
- Additions: Another record year is likely, led by solar. If transmission reforms begin to bite and storage continues doubling, wind’s growth can re‑accelerate in supportive markets.
- Costs: Module prices should remain low given overcapacity; battery prices will track materials and manufacturing learning. Wind costs depend heavily on auction and indexation reforms and OEM margin recovery.
- Policy: Implementation details—hydrogen tax credits, EU market design, and interconnection rules—will determine how fast pipelines convert to steel‑in‑the‑ground projects.
- System operation: The frontier shifts to flexibility. Expect rapid scaling of utility‑scale batteries, aggregated DERs/VPPs, and software to preserve reliability as fossil capacity retires.
If governments deliver on grid and permitting reforms while markets adapt contract structures to macro volatility, the COP28 goal to triple renewables by 2030 remains within striking distance. 2023 showed the supply‑chain capacity exists; the next sprint is making the system ready to absorb it.
Recommended Products
Power after Carbon: Building a Clean, Resilient Grid: Fox-Penner, Peter
In Power after Carbon, Peter Fox-Penner tackles the many thorny questions that arise, presenting a vision for how change is possible, if we rise to the occasion.”―Jeremy Grantham, Cofounder and Chief
Emporia Vue 3 Home Energy Monitor - Smart Home Automation Module and Real Time Electricity Usage Monitor, Power Consumption Meter, Solar and Net Metering for UL Certified Safe Energy Monitoring - Amazon.com
<strong>Add individual 50A sensors to your Vue to monitor up to 16 individual circuits</strong> — providing accurate energy use for the appliances and equipment that is important to you. No guesswork.
EF ECOFLOW Solar Generator DELTA 2 Max 2048Wh with 220W Solar Panel, LiFePO4 Battery Portable Power Station, Up to 3400W AC Output, AC + Solar Fast Dual Charging 0-100% in 1 Hr For Outdoor Camping RV : Patio, Lawn & Garden
Amazon.com : EF ECOFLOW Solar Generator DELTA 2 Max 2048Wh with 220W Solar Panel, <strong>LiFePO4 Battery Portable Power Station, Up to 3400W AC Output, AC + Solar Fast Dual Charging 0-100% in 1 Hr Fo