Energy Storage Explained: Types, Costs, and How It Powers the Grid
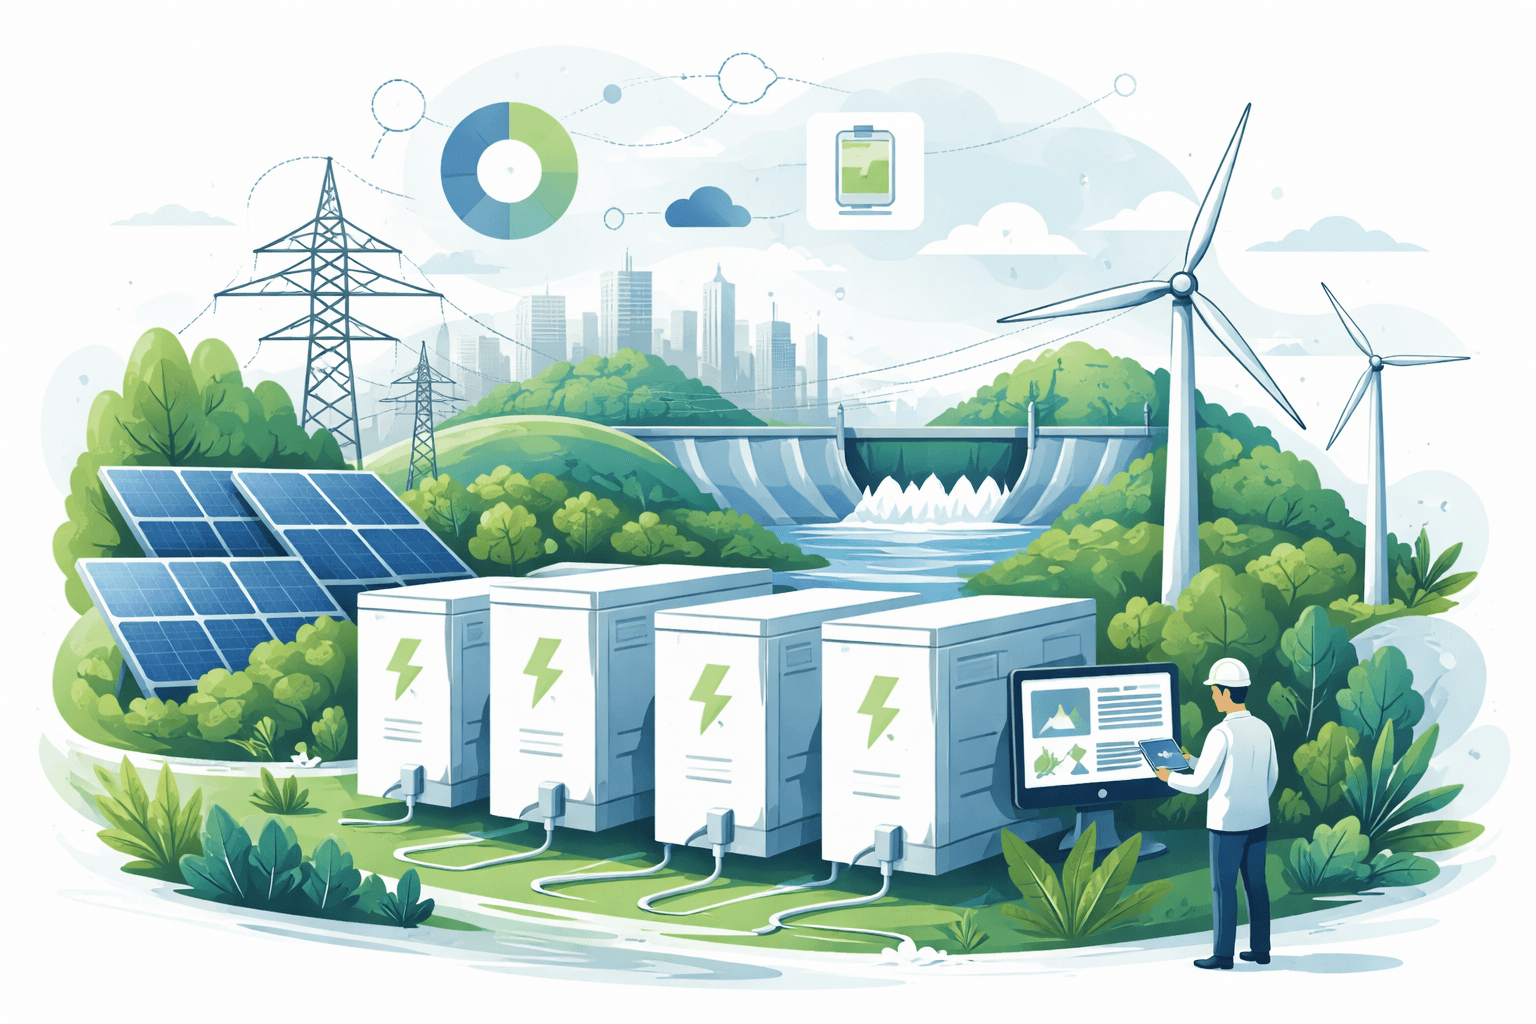
Energy storage is moving from niche pilot projects to core grid infrastructure. In 2023 alone, developers installed roughly 44 GW (about 97 GWh) of new battery storage worldwide, more than doubling global additions year over year, according to BloombergNEF. At the same time, average lithium‑ion battery pack prices fell 14% to $139/kWh (BNEF 2023), resuming a decade-long trend that has cut costs by nearly 90% since 2010. And while batteries are surging, pumped hydro storage still provides the bulk of global capacity—around 180 GW, reports the International Hydropower Association—quietly balancing grids in dozens of countries.
This guide explains energy storage—what it is, why it matters now, how the technologies compare, key performance metrics, where systems are deployed, and what the economics and policies look like. Whether you manage a fleet of solar assets, plan a microgrid, or are just energy‑curious, understanding storage is now essential to understanding the power system.
What is energy storage? Definitions, role, and key concepts
Energy storage captures electricity (or heat) produced at one time for use later. On the grid, storage provides flexibility—absorbing energy when supply exceeds demand and returning it when demand rises or supply falls. This flexibility underpins reliability, cost control, and deeper integration of variable renewables like wind and solar.
Energy Storage: Fundamentals, Materials and Applications: Huggins, Robert
In addition to his many research publications, he is the author of two recent books published by Springer, <strong>Advanced Batteries: Materials Science Aspects and Energy Storage</strong>. ... Editio
Check Price on Amazon- Front‑of‑the‑meter (FTM) storage is connected at the utility or transmission level and participates in wholesale markets.
- Behind‑the‑meter (BTM) storage is located on the customer side (homes) and often pairs with rooftop solar for bill savings and backup.
Two core terms:
- Power (kW or MW): the maximum instantaneous output from storage—how “big the hose” is.
- Energy capacity (kWh or MWh): how much total energy the system can deliver—how “full the tank” is.
- Duration (hours): energy capacity divided by power rating (e.g., a 10 MW/40 MWh battery has 4‑hour duration).
Storage can also provide essential services beyond time‑shifting energy:
- Frequency regulation and fast frequency response (sub‑second to seconds)
- Spinning/non‑spinning reserves (minutes)
- Voltage support and black start (restoring a grid after a blackout)
- Transmission and distribution (T&D) deferral—postponing costly grid upgrades by relieving local peaks
Why energy storage matters now: renewables, grid stability, and resilience
- Variable renewables are growing fast. Solar and wind covered a record ~12% of global electricity in 2023 (Ember), and their share is rising. Energy storage mitigates their variability by shifting solar from midday to evening peaks or absorbing wind surges overnight.
- Reliability under stress. Extreme weather is stressing grids. The United States set a record 28 separate billion‑dollar climate disasters in 2023 (NOAA). Storage provides rapid response and local backup when wires or generators fail.
- Decarbonization at least cost. The International Energy Agency finds that adding flexible resources like energy storage lowers system costs in high-renewables scenarios by reducing curtailment and reliance on peaker plants (IEA, World Energy Outlook 2023).
- Electrification and EVs. As vehicles and heating move to electricity, peak loads rise and shift. Storage helps manage these peaks and can even draw from vehicles via vehicle-to-grid (V2G) programs.
Main energy storage technologies—batteries, mechanical, thermal, and chemical
No single technology fits every use case. Each has tradeoffs in efficiency, duration, cost, siting, and safety. Here’s a plain‑spoken tour of the major options.
Batteries (electrochemical)
Lithium‑ion (Li‑ion): Dominates new deployments today, especially LFP (lithium iron phosphate) and NMC (nickel manganese cobalt).
- Pros: High round‑trip efficiency (85–92%); fast response; modular; mature supply chain; falling costs.
- Cons: Degradation over time (cycle and calendar); thermal runaway risk requiring robust safety systems; typical durations 2–8 hours; supply chain for nickel/cobalt (mostly avoided with LFP).
- Typical use: 1–20 MW systems for solar shifting and frequency regulation; utility‑scale peaker replacement; residential solar+storage.
Flow batteries (e.g., vanadium redox, iron flow): Store energy in liquid electrolytes in external tanks; power (stack size) and energy (tank size) scale independently.
- Pros: Long duration (4–12+ hours); long cycle life (10,000+ cycles) with minimal degradation; non‑flammable electrolytes.
- Cons: Lower efficiency (65–85%); lower energy density; higher upfront cost today; vanadium price volatility (for VRFBs).
- Typical use: Long-duration daily shifting, microgrids, and renewable firming.
Sodium‑ion: Emerging chemistry with lower material cost, good low‑temperature performance, and improving energy density.
- Pros: Reduced critical mineral exposure; potentially lower cost for stationary applications.
- Cons: Early‑stage commercialization; lower energy density than Li‑ion; evolving performance data.
Mechanical storage
Pumped hydro storage (PHS): Two water reservoirs at different elevations; pumps uphill when power is cheap, generates by releasing water through turbines when power is dear.
- Pros: Bulk capacity (hundreds to thousands of MWh); long life (40–80 years); proven at scale; relatively low LCOS for long-duration.
- Cons: Siting constraints (topography, water); environmental and permitting hurdles; long lead times; typical efficiency 70–85%.
- Scale: ~180 GW operating globally (International Hydropower Association).
Compressed air energy storage (CAES): Compress air into caverns or tanks; release through turbines to generate power.
- Pros: Large capacity potential; long life.
- Cons: Conventional (diabatic) CAES uses natural gas during discharge, lowering efficiency (~40–55%). Adiabatic designs (capturing heat) can reach ~60–70% but are less common; siting caverns is difficult.
Liquid air energy storage (LAES): Air liquefied at low temperatures, stored, and expanded to drive a turbine.
- Pros: Uses industrial components; potentially fewer siting constraints than CAES.
- Cons: Moderate efficiency (~50–60%); commercialization ramping.
Flywheels: Store energy as rotational kinetic energy.
- Pros: Very fast response (milliseconds); high power and cycle life; 85–95% efficiency; minimal degradation.
- Cons: Short duration (seconds to minutes); niche for frequency services and power quality.
Thermal storage
Molten salt (often in concentrating solar power, CSP): Heat stored at 300–565°C in salt tanks; later used to run a steam turbine.
- Pros: 6–12+ hour durations routinely; low cost per kWh of thermal energy.
- Cons: When used for electricity, overall efficiency depends on the power block (often 35–45%); CSP geography‑limited; for heat‑only uses, COP can be high with heat pumps.
Low‑temperature thermal (ice/chilled water; phase‑change materials): Shifts HVAC loads by making ice or storing chilled/heat during off‑peak hours.
- Pros: Cost‑effective demand management; excellent for buildings and district energy.
- Cons: Generally used for heat/cooling, not power‑to‑power.
Chemical fuels
Hydrogen (power‑to‑gas‑to‑power): Use electrolysis to make H2 when electricity is cheap/clean; store it; convert back via fuel cells or turbines.
- Pros: Seasonal storage potential; multi‑sector use (industry, transport); can leverage pipelines and salt caverns.
- Cons: Low round‑trip efficiency (typically 25–45%); infrastructure buildout needed; current green hydrogen costs are high though falling (IRENA projects steep declines this decade with low‑cost renewables).
Ammonia/synthetic methane/methanol: Hydrogen carriers and e‑fuels for storage and transport.
- Pros: Easier to store/ship than H2.
- Cons: Conversion losses; NOx control for ammonia combustion; early market stage for power.
By the numbers: the energy storage landscape
- ~180 GW pumped hydro in operation globally (International Hydropower Association, 2023)
- ~44 GW (≈97 GWh) new battery storage added in 2023, a record year (BloombergNEF, 2024)
- 85–92% typical round‑trip efficiency for lithium‑ion; 70–85% for pumped hydro; 65–85% for flow batteries; 25–45% for hydrogen power‑to‑power (NREL/IEA technology briefs)
- $139/kWh average Li‑ion battery pack price in 2023, down 14% year‑over‑year (BloombergNEF)
- 2–8 hours: most common grid battery durations; >10 hours targeted by “long‑duration energy storage” (LDES) efforts (DOE Long Duration Storage Shot)
Key performance metrics to compare systems
- Power (kW/MW) and energy (kWh/MWh): Define the system’s maximum output and total energy content.
- Duration (hours): Energy divided by power; sets how long the system can sustain output at nameplate.
- Round‑trip efficiency (RTE): Discharged energy ÷ charged energy, accounting for all losses. Higher RTE improves arbitrage economics.
- Cycle life and calendar life: How many full cycles until useful capacity falls (often to 70–80% of original) and how many years the system lasts regardless of cycling.
- Depth of discharge (DoD): Fraction of capacity used per cycle; deeper cycles = more useful energy but may reduce life for some chemistries.
- C‑rate: Charge or discharge rate relative to capacity (1C = charge/discharge full capacity in one hour). Higher C‑rates enable faster response but stress cells.
- Response time: Milliseconds (batteries, flywheels) to minutes (thermal, mechanical). Critical for grid services like frequency regulation.
- Self‑discharge: Rate of losing stored energy when idle; low for Li‑ion, extremely low for pumped hydro; higher for some flywheels.
- Safety and siting: Thermal management, fire suppression, hazardous materials, and permitting (e.g., UL 9540/9540A, NFPA 855 standards for battery energy storage systems).
- Cost metrics: Capex ($/kW and $/kWh), fixed/variable O&M ($/kW‑yr, $/MWh), and LCOS/LCOES (levelized cost metrics described below).
Use cases and system sizing: residential, commercial, utility‑scale, microgrids, and EV integration
Residential
Common goals: self‑consumption of rooftop solar, time‑of‑use (TOU) bill savings, and backup power.

EF ECOFLOW Smart Home Panel 2, the Center of the Whole
View on Amazon- Sizing example: A U.S. household using 30 kWh/day aiming for one day of backup at 90% usable capacity and 90% RTE needs ≈ 30 ÷ (0.9 × 0.9) ≈ 37 kWh of nameplate storage. Many homes instead target “critical loads” (refrigeration, lighting, internet, some HVAC), often 10–20 kWh.
- Economics: Savings depend on TOU price spreads and net metering policy. With a $0.25/kWh off‑peak/on‑peak spread, discharging 9 kWh/day (after efficiency) yields ≈$820/year in bill savings; resilience value is additional but hard to monetize without incentives.
Commercial and industrial (C&I)
Goals: demand charge management, TOU arbitrage, resilience, and sometimes power quality for sensitive loads (e.g., data centers).
- Sizing example: A site with a 500 kW peak, aiming to shave 100 kW for two hours, needs roughly a 100 kW/200 kWh system. At a $15/kW‑month demand charge, shaving 100 kW saves ≈$18,000/year, plus arbitrage and potential demand response payments.
Utility‑scale
Goals: renewable firming, peak shaving, capacity adequacy, frequency/voltage support, congestion relief, non‑wires alternatives (NWAs).
- Typical configurations: 25–300 MW power with 2–8 hours duration for daily shifting; >8 hours for long‑duration pilots.
- Co‑location with solar or wind reduces interconnection bottlenecks and allows charging at low marginal cost when the plant would otherwise curtail.
Microgrids and remote systems
Storage enables islands, military bases, and remote communities to integrate high shares of renewables while maintaining reliability and reducing diesel consumption. Microgrids often use a mix: batteries for fast response and short duration, plus generators or long‑duration storage for extended outages.
EV integration
- Managed charging: Shifts EV load to off‑peak periods, acting as a “virtual battery.”
- Vehicle‑to‑home/grid (V2H/V2G): Bi‑directional EVs can supply homes during outages or provide grid services. Aggregated fleets can supply frequency response or peak shaving; standards and interconnection rules (e.g., IEEE 1547) are evolving.
Economics and value stacking: costs, LCOS/LCOES, revenue streams, and payback examples
Cost and levelized metrics
- Capex: Batteries are typically quoted in $/kW (power components) and $/kWh (energy components). For a 4‑hour lithium‑ion system, energy components dominate. Balance‑of‑system (BOS), power electronics, and integration add substantially to pack prices.
- O&M: Fixed O&M ($/kW‑yr) covers monitoring, augmentation, and component replacement; variable O&M ($/MWh) can include degradation‑linked costs.
- LCOS/LCOES: The levelized cost of storage (LCOS) or levelized cost of energy stored (LCOES) spreads all lifetime costs over lifetime discharged energy (in MWh). It depends strongly on utilization (cycles/year), efficiency, and degradation. Lazard’s 2023 LCOS v8.0 estimates utility‑scale 4‑hour lithium‑ion LCOS roughly $131–$232/MWh; distributed C&I around $212–$366/MWh; residential higher given smaller scale and intermittency of use.
Revenue streams (value stacking)
- Energy arbitrage: Buy low, sell high across hours or days. Profits scale with price spreads and efficiency.
- Capacity payments: Many markets pay for “firm capacity” availability (e.g., resource adequacy in CAISO, capacity markets in the UK and PJM). Payments are often $/kW‑year.
- Ancillary services: Frequency regulation, spinning reserve, and voltage support pay $/MW‑h or $/MW for fast, accurate response.
- T&D deferral: Utilities may compensate storage that defers substations or feeder upgrades (non‑wires alternatives).
- Resilience: Some programs pay for critical‑facility backup or islanding capability; otherwise benefits are implicit user value.
Illustrative payback examples (simplified)
Residential 13.5 kWh battery (10 kWh usable/day), TOU spread $0.25/kWh, round‑trip efficiency 90%:
- Annual arbitrage savings ≈ 10 kWh × 0.9 × $0.25 × 365 ≈ $820
- Installed cost $12,000; with a 30% federal tax credit (U.S. IRA), net ≈ $8,400; simple payback ≈ 10 years, faster with outage value or state incentives (e.g., California SGIP).
C&I 500 kW/1,000 kWh system for demand charge management:
- If it reliably trims 100 kW of monthly peak at $15/kW‑mo, demand savings ≈ $18,000/yr; add $20–$40/MWh arbitrage and potential demand response. Many projects target 6–9 year paybacks with incentives and stacked services (NREL case studies).
Utility‑scale 100 MW/400 MWh system in a market with: capacity payment $80/kW‑yr, arbitrage spread $25/MWh for 200 cycles/yr, and ancillary services $10/MW‑h during 500 hours/yr:
- Capacity: 100,000 kW × $80 = $8.0M/yr
- Arbitrage: 400 MWh × 200 × $25 × 0.9 ≈ $1.8M/yr (assuming 90% RTE)
- Ancillary: 100 MW × $10 × 500 h ≈ $0.5M/yr
- Total ≈ $10.3M/yr before O&M; viability depends on capex, augmentation, interconnection, and cycling limits. Actual results vary widely by market rules and dispatch.
Note: Real‑world economics hinge on local tariffs, market design, interconnection studies, degradation strategies (state‑of‑charge windows), and financing. Sensitivity analysis is essential.
Policy, incentives, and market trends
United States
- Investment Tax Credit (ITC): The Inflation Reduction Act (IRA) made standalone storage eligible for a 30% ITC starting in 2023, with adders for domestic content and energy communities. Accelerated depreciation (MACRS) applies for businesses.
- FERC Orders 841 and 2222: Require ISOs/RTOs to integrate storage into wholesale markets and enable distributed resources (including aggregated BTM storage) to participate.
- State programs: California’s Self‑Generation Incentive Program (SGIP) offers $/kWh rebates; New York’s NYSERDA incentives target multi‑GW deployments; multiple state clean peak standards and capacity procurements include storage.
European Union and UK
- EU market design reforms and REPowerEU accelerate renewables and flexibility, recognizing storage as a distinct asset class eligible for support to avoid double charging for grid fees in some markets.
- The UK Capacity Market and ancillary service reforms (e.g., Dynamic Containment) have spurred multi‑GW battery pipelines.
China
- Provincial policies often require renewable projects to include 10–20% of power capacity in storage with 2–4 hour durations; China led global battery storage additions in 2023–2024 (NEA/provincial directives).
India
- Competitive tenders for battery energy storage systems (BESS) and pumped hydro are scaling; the National Electricity Plan envisions tens of GW of storage by early 2030s, including 40+ GW/200+ GWh (CEA/CEA-NEP 2023).
Australia and Japan
- Australia’s National Electricity Market (NEM) is adding large batteries and virtual power plants, supported by state contracts and the Capacity Investment Scheme.
- Japan’s capacity and ancillary reforms plus resilience focus are catalyzing storage at substation and BTM levels.
Safety and environmental regulation
- Codes/standards: UL 9540/9540A, NFPA 855, and local fire codes govern siting and thermal safety for BESS.
- Sustainability: The EU Battery Regulation (2023) phases in carbon footprint rules, recycled content, and due diligence across the battery value chain. Recycling firms (e.g., Northvolt, Redwood Materials, Li‑Cycle) are scaling hydrometallurgical recovery of lithium, nickel, and cobalt.
Market direction: BloombergNEF projects cumulative energy storage installations (excluding pumped hydro) to exceed 1,000 GWh by 2030, a 15–20× increase over 2020 levels, driven by falling costs, renewables growth, and market access reforms.
How to choose the right energy storage solution: checklist and decision framework
Start with the job to be done, not the technology. Then match requirements to technical and economic realities.

Emporia Vue 3 Home Energy Monitor - Smart Home Automation Module and Real Time Electricity Usage Monitor, Power Consumption Meter, Solar and Net Metering for UL Certified Safe Energy Monitoring - Amazon.com
View on Amazon- Define objectives and constraints
- Primary goals: backup, bill savings, capacity, renewable firming, ancillary services, T&D deferral, emissions reduction.
- Critical constraints: site space/weight, noise, fire code setbacks, interconnection timeline, permitting.
- Risk tolerance and procurement model: turnkey EPC, performance guarantees, warranties (years/MWh), augmentation plan.
- Quantify the duty cycle
- Required duration (hours) and cycles per day/week/year.
- Acceptable state‑of‑charge window (e.g., 10–90%) and response time.
- Seasonal needs: daily shifting vs multi‑day/seasonal.
- Translate into specs
- Power (kW/MW), energy (kWh/MWh), and C‑rate to meet target use cases.
- Efficiency target (RTE) to make economics pencil.
- Lifecycle: warranty for throughput and calendar years; augmentation schedule to maintain capacity.
- Screen technologies
- 0.1–1 hour, very high cycle accuracy: flywheel, supercapacitor, or Li‑ion with high C‑rate.
- 2–8 hours, fast response, modular: lithium‑ion (LFP favored for safety/cost); sodium‑ion emerging; flow if long life and >6 hours are priorities.
- 8–20+ hours bulk: pumped hydro where siting allows; flow batteries; novel LDES (iron‑air, thermal) pilots; hydrogen for multi‑day/seasonal with multi‑use value.
- Heat shifting: thermal storage (ice/chilled water, phase‑change) with heat pumps for building loads.
- Model economics and value stack
- Use interval load and price data; include round‑trip efficiency and degradation.
- Stack value streams allowed by your market rules; consider capacity accreditation rules that depend on duration.
- Compare LCOS across scenarios; test sensitivities (price spreads, cycles, augmentation costs, incentives).
- Plan for safety, compliance, and end‑of‑life
- Engage AHJs (authorities having jurisdiction) early; apply UL/NFPA standards.
- Ensure monitoring, thermal management, fire suppression, and emergency response plans.
- Contract for recycling and decommissioning, especially under EU Battery Regulation or similar EPR rules.
- Procurement and contracts
- Seek bankable warranties (capacity retention, throughput, and availability); require 9540A test data.
- Consider performance‑based contracts or tolling arrangements for utility‑scale assets.
Practical implications—what this means for key audiences
- Homeowners: If your utility has steep TOU rates or low export credits for solar, a 10–20 kWh battery can improve self‑consumption and provide backup. Standalone storage qualifies for a 30% U.S. federal tax credit; local incentives can accelerate payback.
- Businesses: Target demand charge reduction with a system sized to shave your top 15‑minute peaks. Evaluate participation in demand response or ancillary programs; ensure interconnection and metering configurations allow stacking.
- Utilities and planners: Co‑locate storage with renewables to reduce curtailment and speed interconnection. Consider non‑wires alternatives and capacity accreditation rules that recognize multi‑hour capability. Engage communities early for siting and safety acceptance.
Where the technology is heading
- Longer duration: DOE’s Long Duration Storage Shot targets a 90% cost reduction for 10+ hour storage by 2030. Iron‑air, flow batteries, and thermal approaches aim to complement Li‑ion for multi‑day reliability.
- Cheaper, safer chemistries: LFP is now dominant in many markets; sodium‑ion and lithium‑manganese‑iron‑phosphate are reducing critical mineral exposure. Advanced BMS and cell‑to‑pack designs lift energy density and safety.
- Software‑defined value: Advanced dispatch algorithms, AI forecasting, and co‑optimization across energy, capacity, and ancillary markets are lifting asset revenues and lifetimes.
- Circularity: Recycling capacity is scaling, and design‑for‑disassembly plus second‑life EV batteries will expand supply and reduce environmental footprints.
Glossary quick hits
- Capacity factor: Percentage of time a storage system outputs at rated power over a period. For storage, this reflects utilization, not fuel availability.
- Curtailment: When renewable generation is available but not accepted by the grid. Storage reduces curtailment by absorbing excess.
- State of charge (SoC): Percentage of a battery’s remaining capacity.
Internal link suggestions
- How Solar Panels Work guide
- Smart Grid and Demand Response explainer
- EV Charging 101 guide
- Hydrogen 101: Production, Costs, and Uses explainer
- Wind Power Capacity Factor Explained analysis
Sources and further reading: International Energy Agency (IEA), International Renewable Energy Agency (IRENA), National Renewable Energy Laboratory (NREL), Lazard Levelized Cost of Storage, BloombergNEF Energy Storage Market Outlook, International Hydropower Association, U.S. EIA/DOE/NOAA.
Recommended Products
Energy Storage: Fundamentals, Materials and Applications: Huggins, Robert
In addition to his many research publications, he is the author of two recent books published by Springer, <strong>Advanced Batteries: Materials Science Aspects and Energy Storage</strong>. ... Editio
EF ECOFLOW Smart Home Panel 2, the Center of the Whole
Alternatively connect <strong>3 x EcoFlow DELTA Pro 3 units with 6 x Extra Batteries for energy storage up to 36kWh</strong>. It's not just for longer backup but lets you to control and run every
Emporia Vue 3 Home Energy Monitor - Smart Home Automation Module and Real Time Electricity Usage Monitor, Power Consumption Meter, Solar and Net Metering for UL Certified Safe Energy Monitoring - Amazon.com
<strong>Add individual 50A sensors to your Vue to monitor up to 16 individual circuits</strong> — providing accurate energy use for the appliances and equipment that is important to you. No guesswork.