How Much Do Solar Panels Cost in 2026? Average Prices & Savings

Solar has never been more affordable. As of early 2026, national quotes for home solar commonly land between $2.50 and $3.50 per watt (W) before incentives, with typical residential systems sized 6–10 kilowatts (kW). If you’re asking how much do solar panels cost, the fast math is: a 7.5 kW system often prices at $18,750–$26,250 gross and $13,125–$18,375 after the 30% federal tax credit.
These figures align with 2024–2025 trends reported by Lawrence Berkeley National Laboratory’s Tracking the Sun, NREL’s cost benchmarks, and SEIA/Wood Mackenzie market data, all of which showed continued declines in hardware costs and wide variation in soft costs by market. Module prices hit record lows globally in 2024 (BloombergNEF), helping keep installed prices in check even as labor and permitting remain persistent cost drivers.
Fast answer: 2026 national averages, cost per watt, typical system sizes
- National average installed price (before incentives): $2.50–$3.50/W for typical rooftop systems
- Typical system sizes: 6–10 kW for detached single-family homes; median around 7–8 kW (LBNL Tracking the Sun)
- Typical gross cost ranges:
- 6 kW: $15,000–$21,000
- 7.5 kW: $18,750–$26,250
- 10 kW: $25,000–$35,000
- Net costs after 30% Federal Investment Tax Credit (ITC): reduce the above by 30%
- Average residential electricity price baseline: ~15–17¢/kWh nationally (U.S. EIA 2024 data); many coastal states exceed 20–30¢/kWh
- Typical payback: 6–12 years depending on location, electricity rates, and financing
Solar Power Your Home For Dummies: DeGunther, Rik
Whether you’re looking to save ... ground up, Solar Power For Dummies, 2nd Edition <strong>takes the mystery out of this energy source and shows you how to put it to work for you</strong>!...
Check Price on AmazonBy the numbers
- $/W spread: Quotes routinely vary by $0.50–$1.00/W in the same market. LBNL observes large price dispersion across installers; the 20th–80th percentile gap often exceeds 20–30%.
- Capacity factor: 14–22% for U.S. rooftops (fraction of time a system produces its nameplate output, varying by solar resource and design)
- Production: Roughly 1,200–1,700 kWh/year per kW installed, depending on solar resource, tilt, shading, and system losses (NREL PVWatts)
Call to action: Comparing at least three quotes typically saves 15–25% on total system cost because of installer price dispersion and differing equipment choices (corroborated by LBNL price spread and DOE soft-cost studies). Get multiple bids and a line‑item breakdown.
What determines the price you’ll pay
Several factors set your final $/W and total project cost.
Site and design factors
- Roof complexity: Steep pitches, multiple roof faces, dormers, skylights, or high‑story work add labor hours and safety rigging.
- Shading and orientation: Heavily shaded sites may need module‑level power electronics (microinverters or optimizers), slightly increasing hardware costs but improving energy yield.
- Structural upgrades: Truss reinforcement, reroofing, or electrical service upgrades (e.g., 100A to 200A) add cost.
- Distance and wiring: Long wire runs, trenching for detached garages, or main panel upgrades increase balance‑of‑system (BOS) costs.
- Interconnection: Utility requirements (e.g., rapid shutdown, meter upgrades) vary by service territory and may add equipment or permitting steps.
Equipment choices
- Modules: Premium high‑efficiency panels (N‑type TOPCon/heterojunction) cost more but can lower $/kWh on constrained roofs.
- Inverters: String inverters are cost‑effective; microinverters and DC optimizers cost more but offer panel‑level monitoring and shade mitigation.
- Racking/mounting: Complicated roofs or specialty mounts (Tile hooks, standing‑seam clamps) affect install time and hardware.
- Batteries: Adding 10–15 kWh of storage typically adds $10,000–$16,000 installed before incentives; the 30% ITC applies when charged by solar (IRS guidance under the Inflation Reduction Act).
Soft costs and labor
- Labor: Regional wages and crew productivity drive a meaningful share of cost.
- Permitting/inspection fees: City/county fees vary widely; some states have streamlined permitting that reduces both time and expense.
- Customer acquisition and overhead: Marketing, sales, and overhead can exceed hardware costs for small installers; DOE/NREL identify soft costs as a leading price driver in the U.S.
Typical cost examples by system size and region
Note: Ranges reflect typical quotes seen in early 2026, grounded in 2024–2025 installer data and NREL/LBNL benchmarks. Prices are before incentives; subtract 30% for net ITC impacts.
3 kW (small homes, limited roof area)
- Sun Belt (AZ, TX, FL): $7,800–$9,900 ($2.60–$3.30/W)
- Midwest: $8,100–$10,500 ($2.70–$3.50/W)
- Northeast: $8,700–$11,400 ($2.90–$3.80/W)
- California/West Coast: $9,000–$12,000 ($3.00–$4.00/W)
Who this fits: Small urban homes or low‑usage households. Note that small systems can have higher $/W due to fixed permitting and mobilization costs.
6 kW (common size for average usage)
- Sun Belt: $15,000–$19,200 ($2.50–$3.20/W)
- Midwest: $15,600–$21,000 ($2.60–$3.50/W)
- Northeast: $16,800–$22,800 ($2.80–$3.80/W)
- California/West Coast: $17,400–$24,000 ($2.90–$4.00/W)
10 kW (larger homes, EVs, electrification)
- Sun Belt: $25,000–$31,000 ($2.50–$3.10/W)
- Midwest: $26,000–$34,000 ($2.60–$3.40/W)
- Northeast: $28,000–$38,000 ($2.80–$3.80/W)
- California/West Coast: $29,000–$40,000 ($2.90–$4.00/W)
Regional notes
- California’s net billing (NEM 3.0) reduces daytime export credit values, nudging many homeowners to add batteries; that raises upfront cost but can improve self‑consumption value.
- Streamlined permitting programs (e.g., SolarAPP+ adoption) tend to lower soft costs; local adoption varies.
- High retail electricity states (CA, HI, parts of the Northeast) often see faster paybacks despite higher installed costs because avoided utility rates are high (EIA).
For market‑specific pricing and incentives, see our state guides: Solar in California: Costs, Incentives & Top Installers (2026), Solar in New York: Costs, Incentives & Top Installers (2026), and Solar in Ohio: Costs, Incentives & Top Installers (2026).
Detailed cost breakdown: where your dollars go
Benchmarks from NREL’s U.S. Solar Photovoltaic System and Energy Storage Cost Benchmarks and LBNL show that hardware is now a minority of residential system cost; soft costs remain substantial.
Typical shares for a grid‑tied rooftop PV system (without battery):
- Modules: 15–25% of total cost. Commodity module prices fell below $0.20/W globally in 2024 (BNEF); installed share is higher due to logistics, margins, and BOS integration.
- Inverters: 5–10% (string inverter) or 10–15% (microinverters/DC optimizers).
- Racking and mounting: 3–8% depending on roof type.
- Electrical BOS (wiring, conduit, combiner boxes): 5–10%.
- Labor (installation and electrical): 7–15% depending on region and roof complexity.
- Permitting, inspection, interconnection fees: 3–8% (can be lower where fees are capped/streamlined).
- Overhead and customer acquisition: 15–25% (sales, design, engineering, travel, warranty reserves, admin).
- Margin: Varies by installer and competitive dynamics.
Line‑item ballparks for a 7.5 kW system (illustrative):
- Modules: $2,500–$4,500
- Inverters: $1,200–$2,800
- Racking/mounting: $600–$1,500
- Electrical BOS: $800–$1,600
- Labor: $1,800–$3,200
- Permitting/fees: $300–$900
- Overhead/acquisition/margin: $6,000–$11,000
For a refresher on how panels and inverters work together, see: Solar Panels Explained: How They Work, Costs, and Installation Guide.
Incentives, rebates, and net metering: how to apply savings
Federal Investment Tax Credit (ITC)
- Value: 30% of eligible project costs for residential solar through at least 2032 under the Inflation Reduction Act (IRS Section 25D).
- Applies to: Solar equipment, labor, permitting, and eligible energy storage when charged by solar.
- How to claim: Apply when filing your federal tax return using IRS Form 5695; you must have sufficient tax liability to realize the full credit (credit can carry forward).
State and local incentives
- Upfront rebates: Many states/utilities offer rebates that reduce the project’s taxable basis; examples include NYSERDA incentives (NY), Illinois Shines/Adjustable Block Program (IL), and occasional utility rebates.
- Performance incentives/SRECs: Markets like New Jersey, Maryland, and Washington, D.C. offer Solar Renewable Energy Credits that create ongoing value per MWh generated.
- Property/sales tax relief: Some states exempt solar from sales tax or offer property tax abatements on the value added by PV.
- Check DSIRE (Database of State Incentives for Renewables & Efficiency) or your state energy office for current programs.
Net metering and export crediting
- Classic net metering credits exported kWh at the retail rate; many states now use “net billing” or time‑varying export credits.
- California NEM 3.0: Exports are valued at hourly avoided‑cost rates, often far below retail midday, increasing the value of self‑consumption and batteries.
- Application to economics: Lower export rates lengthen payback unless you shift more load to solar hours (EV charging, water heating) or add storage.
How to stack incentives correctly
- Subtract upfront rebates from the project cost first.
- Apply the 30% federal ITC to the remaining eligible basis.
- Account for ongoing SREC/performance payments in your annual savings, not upfront.
Financing options and effect on monthly payments
Cash purchase
- Lowest lifetime cost and highest ROI since you avoid interest expense.
- Typical outlays after ITC for a 7.5 kW system: $13,000–$18,000.
Solar loans
- Secured (home equity) or unsecured solar loans typically range ~4.99–9.99% APR depending on credit and term (10–25 years).
- Example: $22,500 gross ($15,750 net after 30% ITC) financed at 6.99% APR for 15 years → roughly $139/month payment. If your average monthly bill savings are ~$150–$220, you may be cash‑flow positive from month one.
Leases and power purchase agreements (PPAs)
- Little/no money down; a third party owns the system, you pay a fixed monthly lease or a per‑kWh price.
- Pros: Transfer maintenance risk; easy entry.
- Cons: Lower lifetime savings, escalators can erode value, may complicate home sale. You generally forfeit the ITC to the system owner (though they often pass along some of the value via lower rates).
Buy vs. lease quick math (illustrative)
- Buy: $25,000 gross, $17,500 net after ITC. 9,750 kWh/year production; bill offset value 22¢/kWh → ~$2,145/year savings. Simple payback ≈ 8.2 years; 25‑year NPV positive with modest rate inflation.
- Lease/PPA: Pay 18¢/kWh with 2.5% annual escalator for the same 9,750 kWh → ~$1,755 first‑year savings versus a 22¢ utility rate, but savings growth may lag if utility rates flatten and the escalator compounds.
Tip: Always compare the loan payment or lease/PPA rate against the effective kWh value you avoid from your utility, including fixed charges.
Savings, ROI, and payback time: three scenarios
Assumptions used below
- Performance: 1,300–1,700 kWh/kW/year depending on location (NREL PVWatts typical ranges)
- Electricity prices (first‑year retail): based on recent EIA state averages; escalator 2%/yr for modeling
- Degradation: 0.5%/year module output decline
- ITC: 30%
- Prices: Within national ranges above; small systems tend to have higher $/W
Scenario A: Urban, high rates, small roof (New York City)
- System: 4 kW, microinverters due to partial shade
- Installed cost: $3.60/W → $14,400 gross; $10,080 net after ITC
- Production: ~5,200 kWh/year (1,300 kWh/kW/yr)
- Rate: 24¢/kWh blended
- First‑year savings: ~$1,248
- Simple payback: ~8.1 years; 25‑year IRR high single digits to low double digits depending on rate growth
- Notes: High retail rates and good south‑facing exposure overcome higher $/W. Consider demand response and daytime load shifting to maximize self‑use.
Scenario B: Suburban, strong sun, average rates (Phoenix metro)
- System: 8 kW, string inverter
- Installed cost: $2.70/W → $21,600 gross; $15,120 net after ITC
- Production: ~13,600 kWh/year (1,700 kWh/kW/yr)
- Rate: 14¢/kWh average, time‑of‑use applies
- First‑year savings: ~$1,904
- Simple payback: ~7.9 years; accelerated if you shift HVAC/EV charging to solar hours
- Notes: Exceptional solar resource drives strong kWh yield; even with moderate retail rates, payback is attractive.
Scenario C: Rural, moderate sun, modest rates (Ohio)
- System: 10 kW, string inverter with optimizers on a few shaded strings
- Installed cost: $2.80/W → $28,000 gross; $19,600 net after ITC
- Production: ~13,500 kWh/year (1,350 kWh/kW/yr)
- Rate: 16¢/kWh
- First‑year savings: ~$2,160
- Simple payback: ~9.1 years; many Ohio utilities offer net metering variants—check current export rules
- Notes: Roof simplicity helps keep $/W low; pairing with an electric vehicle or heat pump can improve self‑consumption.
Want local numbers, incentives, and vetted installers? Start with your state page: Solar in Ohio: Costs, Incentives & Top Installers (2026) and Solar in New York: Costs, Incentives & Top Installers (2026).
How to get accurate quotes: checklist, comparison template, next steps
Twelve‑point installer and proposal checklist
- License and insurance: Verify active contractor license and $1M+ liability coverage; ask for proof.
- NABCEP credentials: Preferred for project managers/lead installers.
- Local references: At least 3 recent installs within 25 miles.
- Equipment makes/models: Module and inverter part numbers, datasheets, and warranty terms (modules 25–30 years performance, 12–25 years product; inverters 10–25 years).
- Production estimate: kWh/year with assumptions (tilt, azimuth, shading losses, degradation); request PVWatts or equivalent modeling file.
- Line‑item pricing: Modules, inverters, racking, BOS, labor, permits, overhead; identify any dealer fees in financing.
- Roof and structural assessment: Method and any required upgrades; clarify who pays if surprises arise.
- Interconnection timeline: Utility steps, metering, expected PTO date, and who handles paperwork.
- Monitoring: Portal access, data granularity (system vs. module level), and data retention.
- Change‑order policy: How are scope changes approved and priced?
- Service and workmanship warranty: Term (aim for 10+ years), response time, and what’s covered (leaks, labor on warranty swaps).
- Escalation and contact: Named project manager with direct line/email.
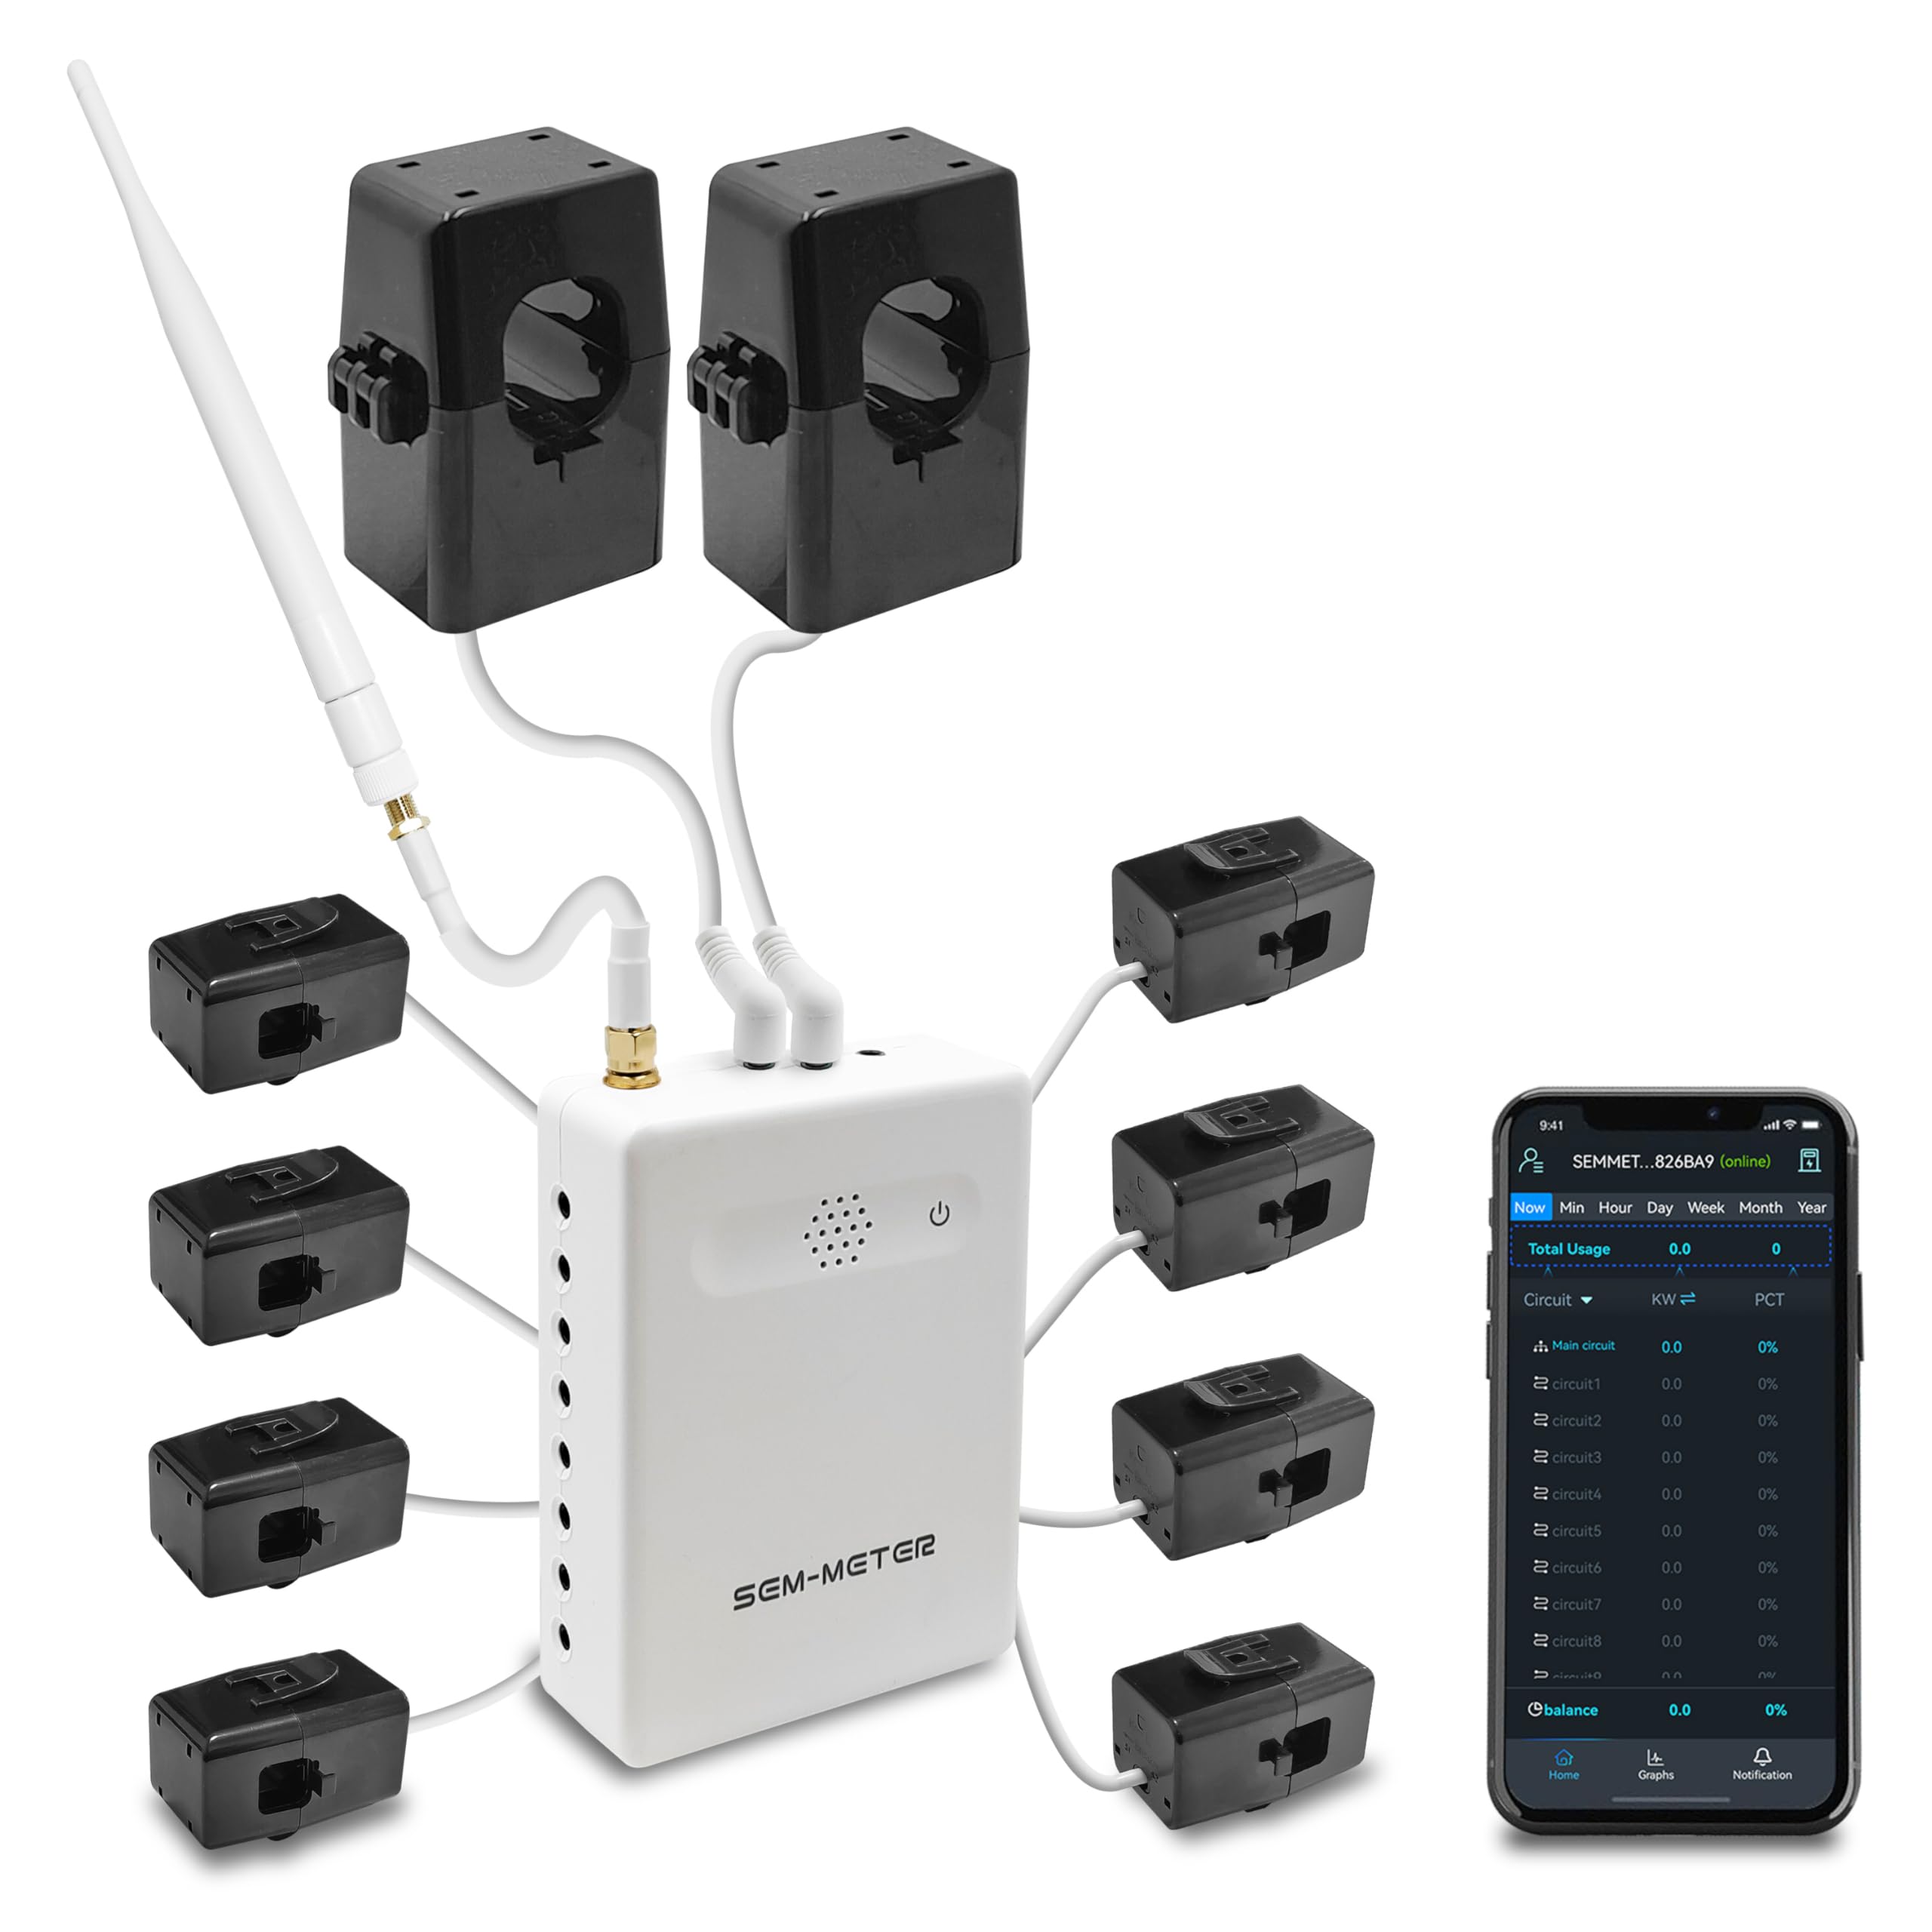
Smart Home Energy Monitor with 8 50A Circuit Level Sensors | Vue - Real Time Electricity Monitor/Meter | Solar/Net Metering - Amazon.com
View on AmazonComparison template (capture this for each quote)
- System size (kW DC) and expected annual kWh
- $/W and total price (gross and net after incentives)
- Equipment brands and warranties
- Financing terms (APR, term, dealer fee, prepayment rules)
- Modeled year‑1 production and performance ratio
- Interconnection/export rate assumptions
- Projected payback/IRR and sensitivity to export rate changes
- Installation timeline and permit/interconnection milestones
Next steps
- Gather 3–5 quotes. Ask each installer to bid the same system size and layout so you can compare apples to apples.
- Request at least one alternative configuration (e.g., string inverter vs. microinverters) to see cost/performance tradeoffs.
- Validate assumptions: Cross‑check the production estimate in NREL PVWatts and your utility bill history.
- Negotiate: Use the most competitive bid to request matched pricing or upgraded equipment. LBNL price dispersion indicates room to save.
Call to action: Ready to see your real numbers? Request multiple quotes and compare line‑items side by side. Homeowners who shop around often save 15–25% and cut payback by 1–3 years.
How much do solar panels cost: key takeaways for 2026
- Expect $2.50–$3.50/W for most residential quotes this year; small/complex jobs may land higher, straightforward jobs lower.
- After the 30% ITC, many 6–10 kW systems net $14,000–$24,000.
- Paybacks of 6–12 years are common, faster in high‑rate states or with good self‑consumption.
- The biggest savings lever you control is comparison shopping and insisting on transparent, line‑item proposals.
For a deeper technical primer on system components and installation steps, see: Solar Panels Explained: How They Work, Costs, and Installation Guide. And if you want state‑specific pricing and incentives, explore: Solar in California: Costs, Incentives & Top Installers (2026).
Sources and data notes: Figures reflect ranges observed in 2024–2025 data from Lawrence Berkeley National Laboratory (Tracking the Sun), the National Renewable Energy Laboratory (U.S. Solar Photovoltaic System and Energy Storage Cost Benchmarks), SEIA/Wood Mackenzie U.S. Solar Market Insight, the U.S. Energy Information Administration (retail electricity prices), and BloombergNEF (module price trends). Local quotes in 2026 will vary by site, equipment, soft costs, and policy context.

EMPORIA Level 2 EV Charger w/ J1772 Charger, 48 amp ...
View on AmazonRecommended Products
Solar Power Your Home For Dummies: DeGunther, Rik
Whether you’re looking to save ... ground up, Solar Power For Dummies, 2nd Edition <strong>takes the mystery out of this energy source and shows you how to put it to work for you</strong>!...
Smart Home Energy Monitor with 8 50A Circuit Level Sensors | Vue - Real Time Electricity Monitor/Meter | Solar/Net Metering - Amazon.com
Lightweight commercial 3-phase option available as a separate bundle. APPLICATION MONITORING WITHOUT GUISEWORK <strong>Up to sixteen (16) 50A sensors to accurately monitor your air conditioner, oven,
EMPORIA Level 2 EV Charger w/ J1772 Charger, 48 amp ...
Explore a wide selection of hardwired Level 2 EV charging stations. Features include 25-foot cables, app control, and weather-resistant construction.