Drone Technology for Conservation: How Aerial Tools Are Helping Protect Nature
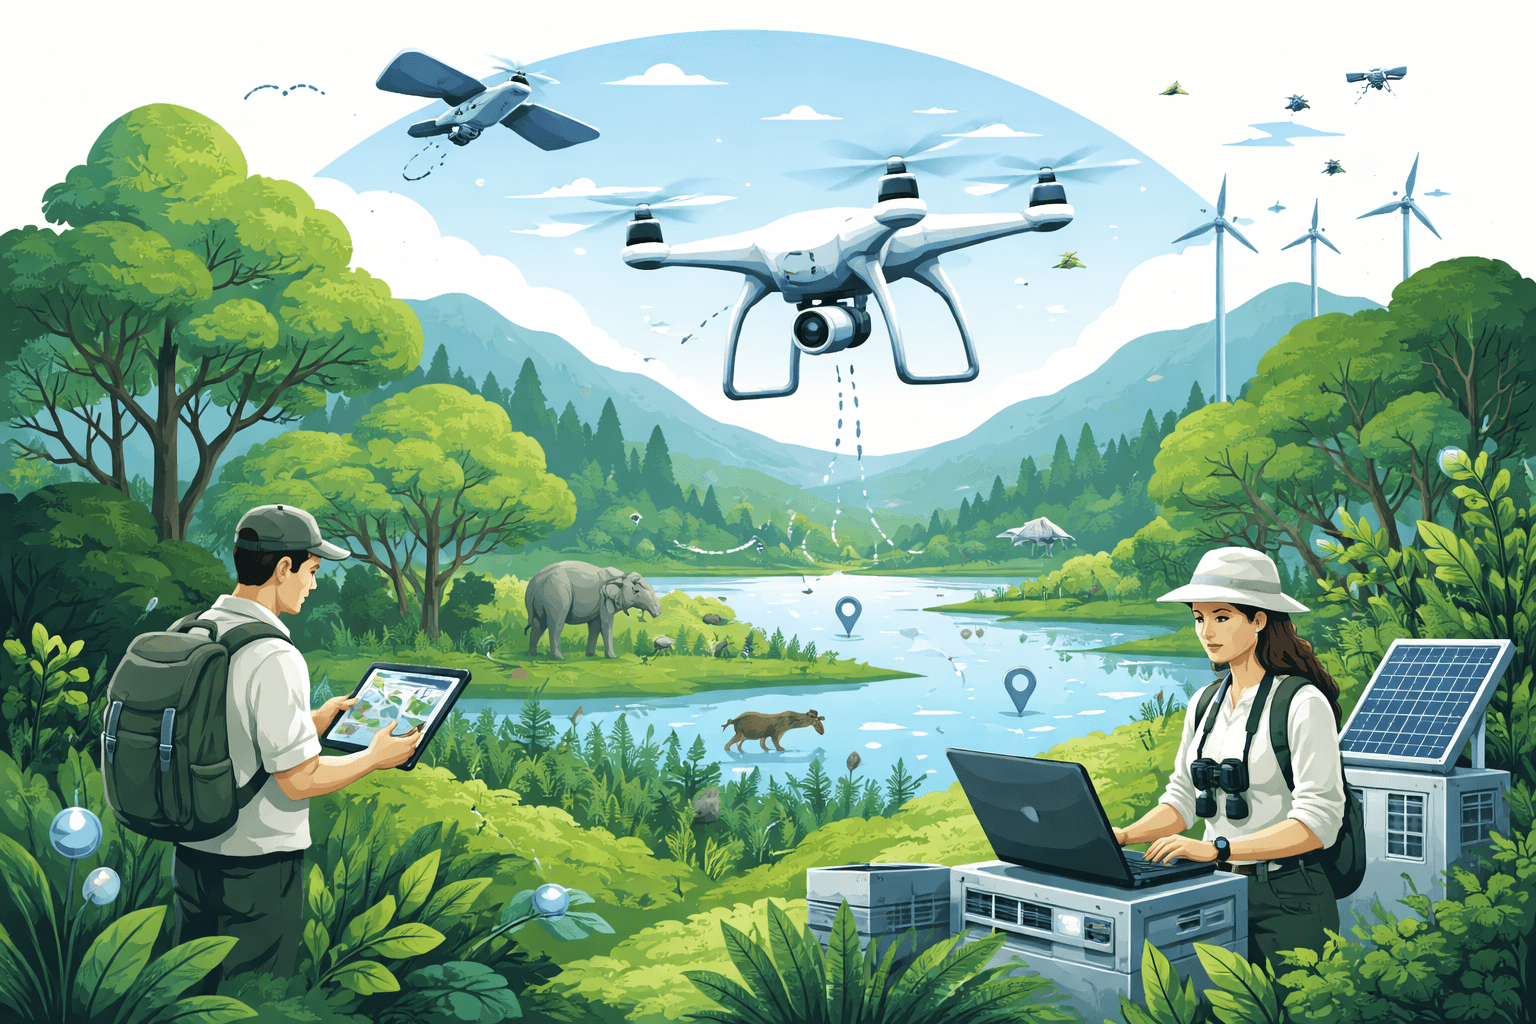
Drones are reshaping conservation practice. In controlled tests, drone-based wildlife counts were 43% more accurate than ground surveys for seabird colonies (Hodgson et al., Methods in Ecology and Evolution, 2018). Field teams report 2–10x faster mapping of habitats than walking transects, with centimeter‑level detail. As costs fall and sensors improve, drone technology for conservation is moving from pilot projects to standard practice in many landscapes and seascapes.
This explainer breaks down what drones are in a conservation context, where they’re used, what data they collect, and how to deploy them responsibly alongside fieldwork and community knowledge.
What is drone technology for conservation?
“Drones” (also called unmanned aerial vehicles, UAVs, or uncrewed aircraft systems, UAS) are small aircraft without onboard pilots. In conservation, they carry sensors—visible-light cameras, thermal imagers, multispectral or hyperspectral cameras, LiDAR (laser scanning), and sometimes acoustic mics or gas sensors—to collect georeferenced data. Two main airframes are common:
Drones for Biodiversity Conservation and Ecological Monitoring: Díaz-Delgado, Ricardo, Mücher, Sander
It documents the enhancement of knowledge in ecological integrity parameters mapping, long-term ecological monitoring based on drones, mapping of alien species spread and distribution, upscaling ecolo
Check Price on Amazon- Multirotors: Vertical takeoff/landing, highly maneuverable, typical flight time 20–45 minutes, excellent for small sites and detailed imaging.
- Fixed‑wing: Airplane‑style, longer endurance (60–180+ minutes), better for covering tens of square kilometers per day.
A key advantage is pairing high-resolution data with precise positioning. Using real-time kinematic (RTK) or post-processed kinematic (PPK) GPS, teams can achieve sub‑5 cm horizontal accuracy for map products without dense ground control points.
Core conservation use cases
1) Wildlife surveys and species monitoring
- Colonies and herds: High‑resolution orthomosaics allow precise counts of seabirds, seals, or ungulates. Studies find higher accuracy and repeatability than human counts, especially in dense colonies.
- Cryptic or nocturnal species: Thermal infrared (7.5–13 μm) cameras detect warm‑bodied animals against cooler backgrounds at dawn/dusk or night. Trials have shown higher detection probabilities for koalas, deer, and primates relative to ground observers, particularly in complex vegetation.
- Marine megafauna: Fixed‑wing drones with downward‑facing cameras survey whales, dolphins, and dugongs over coastal waters at lower cost and risk than crewed aircraft, while enabling photogrammetric measurements (e.g., body length and condition).
- Nest surveys: Drones detect orangutan and raptor nests more efficiently than ground transects, improving density estimates and reducing time in difficult terrain.
Where relevant, AI models now automate counting, sex/age‑classing, and behavioral annotation in imagery. See our overview of tools and data needs in AI for Wildlife Monitoring: Technologies, Data Needs, and Practical Conservation Applications (/sustainability-policy/ai-for-wildlife-monitoring-technologies-data-needs-practical-conservation).
2) Anti‑poaching patrols and ranger support
- Aerial overwatch: Thermal cameras and zoom payloads extend ranger situational awareness at night and over large areas. Drones cue ground patrols to suspicious activity while recording evidence.
- Risk reduction: Aerial scouting keeps rangers out of ambush‑prone areas and dangerous wildlife corridors.
- Deterrence and documentation: Visible overflights can deter incursions; recorded footage supports prosecutions.
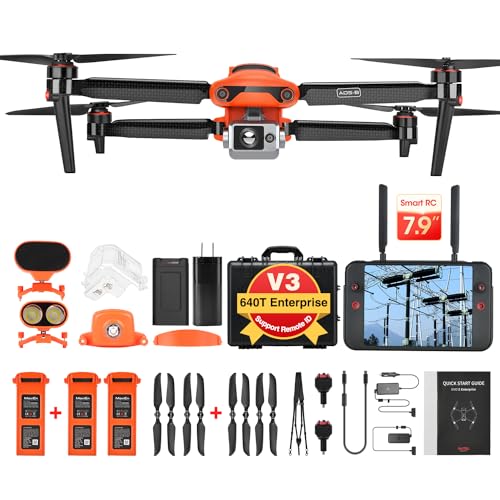
Autel Robotics EVO II Dual 640T Enterprise V3, 640*512 30Hz T~hermal&8" RYYB CMOS Sensor,10 Color Schemes, 4X lossless Zoom, 42 Min,15KM Transmission, Support Remote ID,w/Strobe/Spotlight/ Loudspeaker : Industrial & Scientific
View on AmazonMost agencies stress that drones complement, not replace, intelligence‑led patrols, community partnerships, and informant networks. Integrating drones into established command‑and‑control workflows is critical.
3) Habitat mapping and ecosystem monitoring
- Vegetation structure and health: Multispectral cameras (e.g., red, green, blue, red‑edge, near‑infrared) produce indices like NDVI to assess plant vigor and stress. LiDAR captures 3D canopy height models (CHM) and digital terrain models (DTM) under partial canopy.
- Wetlands, mangroves, and peatlands: High‑resolution mapping improves extent and degradation estimates, identifies channels and erosion, and monitors restoration sites that are hard to traverse on foot.
- Coral reefs and seagrass: In clear, shallow water, RGB and multispectral drones classify benthic habitats and map bleaching and algal overgrowth at sub‑meter scales.

DJI Mavic 3, Drone with 4/3 CMOS Hasselblad Camera, 5.1K Video, Omnidirectional Obstacle Sensing, 46 Mins Flight, Advanced Auto Return, 15km Video Transmission, FAA Remote ID Compliant, Gray : Toys & Games
View on AmazonThese products slot directly into GIS workflows to prioritize protection, plan restoration, and quantify change over time.
4) Reforestation and restoration support
- Site reconnaissance: Drones delineate microtopography, soil moisture proxies, and canopy gaps to guide planting layouts and access routes.
- Precision seeding: Experimental seed‑pod drones deliver native species mixes to inaccessible slopes or wetlands. While establishment rates vary widely by species and site, drones can target microsites (e.g., nurse shrubs, moist depressions) more precisely than broadcast seeding.
- Monitoring survival: Periodic flights quantify seedling survival, canopy closure, and invasive regrowth, enabling adaptive management and cost control.
5) Disaster damage assessment and recovery
- Rapid situational awareness: After floods, cyclones, wildfires, or landslides, drones map damage perimeters, blocked wildlife corridors, and hazardous trees with centimeter‑scale detail.
- Post‑fire ecology: Thermal and multispectral data inform burn severity mapping and watershed stabilization. Early flights help plan erosion control and replanting.
- Coastal storms: Orthomosaics and elevation models track dune and wetland loss, guiding nature‑based solutions for future resilience.
What data do drones collect—and how is it used?
- RGB (visible-light) imagery: Produces orthomosaics (stitched, georeferenced images) at 1–5 cm/pixel. Used for counting animals, delineating habitats, detecting trails or encroachments, and documenting change.
- Multispectral/hyperspectral: Narrow bands beyond visible light quantify plant pigments and water content. Indices (NDVI, NDRE) flag stress, invasive species, or nutrient limitations. Hyperspectral (dozens to hundreds of bands) enables species‑level discrimination in some contexts.
- Thermal infrared (longwave): Detects temperature differences for wildlife at night, nest heat signatures, or post‑fire hotspots. Also used to map cold‑water refugia in streams.
- LiDAR (laser scanning): Generates dense 3D point clouds to model canopy height, vertical structure, and bare‑earth terrain under vegetation. Validations commonly show strong agreement with field plots (correlations R² > 0.9 for canopy height in many forest types).
- Photogrammetry: From overlapping RGB images, software reconstructs 3D surfaces (digital surface models, DSMs) and volumetrics (e.g., sand dune or woody debris volumes).
- Acoustic and gas sensors (emerging): Lightweight microphones for bird/bat activity and gas sensors for methane or sulfur compounds in wetlands—use cases are growing but remain specialized.
Data to decision: Drone products (GeoTIFFs, shapefiles, point clouds) feed into GIS for habitat classification, corridor design, and threat mapping. AI can automate animal detection, nest identification, and land‑cover segmentation; see How Technology Aids Conservation: Sensors, AI, and Renewable Solutions (/sustainability-policy/how-technology-aids-conservation-sensors-ai-renewables) for sensor‑to‑insight pipelines.
By the Numbers
- 43%: Improvement in wildlife count accuracy with drones vs. ground observers in controlled seabird colony tests (Hodgson et al., 2018, Methods in Ecology and Evolution).
- 20–45 minutes: Typical multirotor endurance per flight; 60–180+ minutes for fixed‑wing platforms of similar weight class.
- <5 cm: Achievable horizontal mapping accuracy with RTK/PPK positioning, adequate ground control, and good flight planning.
- 2–10x: Typical speed‑up reported by teams for mapping and counting tasks vs. ground transects in accessible terrain, larger multipliers in wetlands and mangroves.
- $1,500–$10,000: Prosumer drone costs with high‑quality RGB/thermal sensors; $20,000–$100,000+ for LiDAR payloads and heavy‑lift platforms.
Benefits and limitations in practice
Benefits
- Coverage and access: Reach remote cliffs, wetlands, and dense understory without risking crews. Fixed‑wings cover tens of km² per day; multirotors can thread tight canopies for gap mapping.
- Resolution: Centimeter‑scale imagery detects nests, seedlings, and tracks invisible to satellites or crewed aircraft.
- Safety and cost: Replaces many low‑altitude helicopter flights, lowering operational risk and cost per survey hour. Electric drones have far lower energy use and associated emissions than crewed aircraft for equivalent imaging tasks.
- Repeatability: Standardized flight plans and altitudes enable consistent time‑series monitoring across seasons and years.
- Data integration: Outputs slot directly into GIS, complementing satellite data and field plots.
Limitations and risks
- Battery life and payload: Endurance limits area coverage and sensor combinations; heavy payloads shorten flight time.
- Weather: Wind, rain, and high temperatures degrade stability and image quality; many drones are not fully weather‑sealed.
- Regulations and permits: In the U.S., FAA Part 107 generally requires visual line of sight (VLOS), daylight/twilight operations, and altitude ≤400 ft (122 m) AGL unless waived. Beyond visual line of sight (BVLOS) and flights over people often need waivers. In the EU, EASA’s Open/Specific/Certified categories govern risk and operating limits. Many protected areas restrict or ban drones without research permits; U.S. National Parks prohibit recreational drone use.
- Wildlife disturbance: Noise and proximity can stress animals. Experiments show elevated heart rates in black bears during drone overflights even without visible behavioral change (Ditmer et al., Current Biology, 2015). Seabirds may flush at low altitudes or with direct overhead approaches. Mitigation includes higher altitudes, lateral approaches, quieter props, and avoiding sensitive periods (e.g., nesting).
- Data governance and ethics: Sensitive data (e.g., nest locations, rhino movements) must be protected. Community consent and cultural site privacy are essential.
- Skills and workflows: High‑quality outputs require flight planning, geodesy basics, and photogrammetry or LiDAR processing expertise. Processing can be compute‑intensive.
For broader considerations on responsible tech deployment and minimizing unintended impacts, see Using Technology for Environmental Protection: Tools, Impacts, and Practical Guidance (/sustainability-policy/using-technology-for-environmental-protection-tools-impacts-practical-guidance).
Real‑world impact and lessons from the field
- Seabird and pinniped colonies: Drone surveys deliver repeatable counts with lower disturbance than walking through colonies. In comparative studies, drone counts showed both higher accuracy and narrower confidence intervals relative to ground teams, improving trend detection for managers.
- Forest structure and biomass: UAV LiDAR captures canopy height and gap dynamics that correlate strongly with plot‑based measurements. Managers use these data to identify windthrow, ladder fuels, and priority thinning areas, accelerating climate‑smart forestry.
- Primates and arboreal mammals: Drones detect orangutan nests over broad areas in Borneo and Sumatra, aligning with ground‑transect density estimates but at a fraction of field effort. Thermal and RGB combinations improve detection in mixed canopies.
- Anti‑poaching operations: Park agencies report faster response times and expanded night coverage when integrating thermal drones into patrols. Success hinges on clear standard operating procedures (SOPs), secure data handling, and ranger training.
- Restoration: Mangrove projects use drones to map elevation and tidal channels, targeting planting to microhabitats with higher survival probability. Experimental seed‑pod deployments show promise on steep slopes and remote sites; peer‑reviewed assessments emphasize tailoring species and seed treatments to site conditions.
- Disaster response: After wildfires and cyclones, drone‑derived burn severity maps and orthomosaics guide trail reopening, erosion control, and habitat triage within days rather than weeks.
A consistent pattern emerges: drones amplify, not replace, field ecology. The best outcomes pair aerial data with ground truthing, local ecological knowledge, and community stewardship. For integrating tech into survey design and evaluation, see Wildlife Conservation Methods: Practical Approaches, Tech Tools, and How to Measure Success (/sustainability-policy/wildlife-conservation-methods-practical-approaches-tech-tools-measure-success).
How drone data turns into decisions
- Plan the question: What decision hinges on the data? E.g., estimate colony size, map invasive spread, or prioritize riparian planting.
- Choose sensor and altitude: Match ground sample distance (GSD) to the smallest feature you must detect (e.g., 2–3 cm for nests, 10–20 cm for seedlings). Select RGB, multispectral, thermal, or LiDAR accordingly.
- Flight planning: Ensure 70–80% image overlap, consider sun angle and wind, and incorporate RTK/PPK for positional accuracy. Use ground control points (GCPs) for rigorous change detection.
- Processing: Photogrammetry (e.g., structure‑from‑motion) yields orthomosaics and DEM/DSM; multispectral pipelines compute vegetation indices; LiDAR processing outputs point clouds and canopy metrics.
- Analysis and validation: Automate counts or classifications where feasible; validate with stratified ground checks. Quantify uncertainty to support robust management decisions.
- Reporting and archiving: Package geospatial layers and methods so results are reproducible and auditable—a prerequisite for policy, permitting, or finance (e.g., carbon projects).
Practical guidance for teams getting started
- Start with clear use cases: Pick one or two high‑value tasks (e.g., colony counts, erosion mapping) to build skills and workflows.
- Match platform to landscape: Multirotors for small, complex sites; fixed‑wings for larger, open areas. Consider noise profile near sensitive fauna.
- Budget realistically: Include spares, batteries, chargers, field tablets, RTK base, software, data storage, and training. Cloud processing fees can rival hardware costs at scale.
- Train and certify: Ensure pilot competency and regulatory compliance; develop wildlife‑safe flight SOPs with ecologists.
- Engage communities and authorities: Secure permits, respect cultural sites, and co‑design flight plans with local stewards. Share results in accessible formats.
- Protect sensitive data: Mask or generalize locations of vulnerable species; limit public sharing of raw tracks or nest coordinates.
For broader context on tech’s role in conservation and responsible implementation, see How Technology Is Transforming Conservation: Tools, Impacts, and Responsible Deployment (/sustainability-policy/role-of-technology-in-conservation).
What’s next: trends to watch
- BVLOS and autonomy: Regulators are piloting beyond‑visual‑line‑of‑sight corridors and operations over people/vehicles. As autonomy and detect‑and‑avoid mature, drones will cover larger areas with fewer launches.
- Edge AI: Onboard models will flag animals, people, or fires in real time, cueing rangers without high‑bandwidth links. Compression and quantization are making these models viable on small processors.
- Longer endurance: Hybrid‑electric and hydrogen fuel‑cell platforms promise 3–5 hour endurance with modest payloads, expanding patrol radii and regional mapping.
- New sensors: Lightweight hyperspectral cameras and compact LiDAR are moving into prosumer price ranges. Thermal resolution and radiometric accuracy continue to improve.
- Drone‑satellite fusion: Satellites map landscape change; drones validate and calibrate at high resolution. Expect more workflows that downscale satellite alerts into targeted drone surveys.
- Ethical frameworks: Clearer standards for wildlife disturbance thresholds, data privacy, and community consent will be embedded into funding and permitting.
Drones are now part of the conservation toolbox—most powerful when they serve the questions ecologists and communities are already asking. With careful planning, strong ethics, and rigorous validation, aerial data can accelerate protection, restoration, and adaptive management across ecosystems.
Recommended Products
Drones for Biodiversity Conservation and Ecological Monitoring: Díaz-Delgado, Ricardo, Mücher, Sander
It documents the enhancement of knowledge in ecological integrity parameters mapping, long-term ecological monitoring based on drones, mapping of alien species spread and distribution, upscaling ecolo
DJI Mavic 3, Drone with 4/3 CMOS Hasselblad Camera, 5.1K Video, Omnidirectional Obstacle Sensing, 46 Mins Flight, Advanced Auto Return, 15km Video Transmission, FAA Remote ID Compliant, Gray : Toys & Games
Buy DJI Mavic 3, Drone with <strong>4/3 CMOS Hasselblad Camera, 5.1K Video, Omnidirectional Obstacle Sensing, 46 Mins Flight, Advanced Auto Return, 15km Video Transmission, FAA Remote ID Compliant, Gr
Autel Robotics EVO II Dual 640T Enterprise V3, 640*512 30Hz T~hermal&8" RYYB CMOS Sensor,10 Color Schemes, 4X lossless Zoom, 42 Min,15KM Transmission, Support Remote ID,w/Strobe/Spotlight/ Loudspeaker : Industrial & Scientific
Autel Robotics EVO II Dual 640T V3, 640x512 Thermal Imaging Drone, Remote ID Supported, 0.8'' CMOS&50MP 8K RYYB Sensor,10+ Temp Measurement, D-RI Ranges, Thermal Analysis Tool, for Searc
More in AI & Technology
- How Technology Aids Conservation: Sensors, AI, and Renewable Solutions
- AI for Wildlife Monitoring: Technologies, Data Needs, and Practical Conservation Applications
- Beyond the Algorithm: How AI Is Transforming — and Challenging — Wildlife Protection
- How Technology Is Transforming Conservation: Tools, Impacts, and Responsible Deployment