How Satellite Monitoring Helps Track Deforestation in Real Time
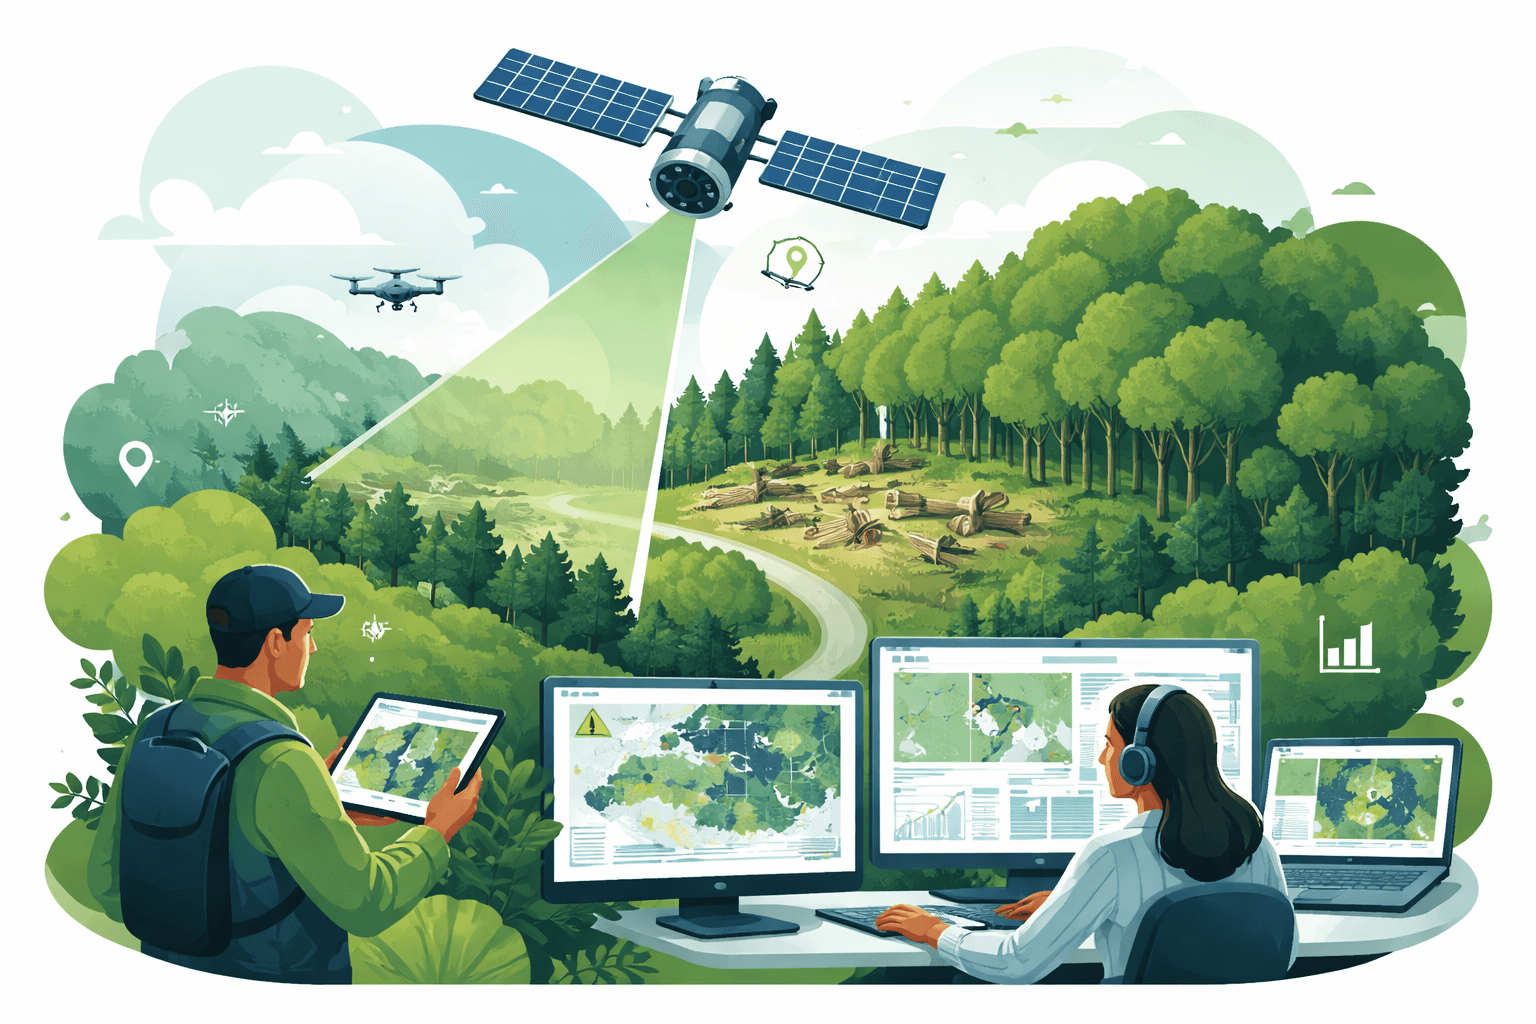
Satellite monitoring deforestation has moved from annual reports to near-real-time alerts, changing how governments, conservation groups, and communities respond to forest loss. Global platforms now flag new clearings within days, not months. According to FAO’s Global Forest Resources Assessment (2020), gross deforestation averaged roughly 10 million hectares per year in 2015–2020, while Global Forest Watch estimates tropical primary forest loss alone released about 2.7 gigatons of CO2 in 2022. With real-time data, those trends can be tracked as they unfold—and interrupted sooner.
What satellite monitoring of deforestation means
Satellite monitoring of deforestation uses remote sensing—collecting information about Earth’s surface without physical contact—to detect forest loss, land-use change, and degradation over time. Sensors mounted on satellites measure reflected sunlight (optical), emitted thermal energy, or active microwave pulses (radar). By comparing images across dates, analysts identify where tree cover has been removed, selectively logged, burned, or degraded.
Introduction to Remote Sensing: Campbell, James B., Wynne, Randolph H., Thomas, Valerie A.
Now in full color, the sixth edition ... features <strong>new chapters on remote sensing platforms (including the latest satellite and unmanned aerial systems), agriculture (including agricultural ana
Check Price on AmazonKey concepts:
- Remote sensing: Capturing surface information from a distance using satellite sensors.
- Time series analysis: Comparing repeated observations to flag changes.
- Land cover vs. land use: Land cover is the biophysical state (forest, cropland). Land use is how people use it (logging, agriculture). Remote sensing sees cover directly and infers use with context.
- Degradation: Partial canopy loss or damage (e.g., selective logging, understory fires). Harder to detect than clear-cuts but increasingly measurable with radar and LiDAR.
How satellite monitoring deforestation works
Satellite monitoring deforestation relies on repeat imaging, spectral or backscatter signatures of vegetation change, and algorithms that highlight anomalies across time.
Optical imagery: Seeing the canopy
Optical satellites measure reflected sunlight in visible and near-infrared bands. Vegetation has a distinctive “red edge” and high near-infrared reflectance. Clearing trees reduces these signals. Common datasets:
- Landsat 8/9 (USGS/NASA): 30 m resolution, global, free, with a combined repeat of about 8 days at the equator.
- Sentinel‑2A/B (ESA): 10–20 m resolution, 5-day revisit at the equator, free.
- MODIS (NASA): Coarser (250–500 m) but daily coverage for continental-scale context.
- Commercial constellations (e.g., PlanetScope): 3–5 m resolution, daily revisits; widely used in the tropics via Norway’s NICFI program, which provides high-resolution monthly basemaps for the tropical belt at no cost for noncommercial use.
Optical change detection typically uses vegetation indices such as NDVI (Normalized Difference Vegetation Index) or NBR (Normalized Burn Ratio) and compares pixel values across dates to identify loss. Cloud cover is a consistent limitation in humid tropics; multi-sensor fusion and radar help close gaps.
Radar (SAR): Seeing through clouds
Synthetic Aperture Radar (SAR) sends microwave pulses and measures the backscatter. Because it is an active system and uses wavelengths that penetrate clouds and operate day/night, SAR is crucial where optical data are obscured by weather.
- Sentinel‑1 (ESA, C‑band): ~10 m resolution, frequent revisits, free.
- ALOS‑2 (JAXA, L‑band): Better sensitivity to forest structure and degradation.
- Upcoming/next‑gen missions (e.g., NASA‑ISRO NISAR) are designed to improve biomass and disturbance mapping at scale.
Forest clearing typically reduces SAR backscatter as rough, canopy-rich surfaces are replaced by smoother bare soil or low vegetation. Degradation (selective logging) often shows subtler patterns that time series radar can detect.
LiDAR: Measuring structure and biomass
Spaceborne LiDAR (Light Detection and Ranging) directly measures canopy height and vertical structure. NASA’s GEDI instrument on the International Space Station has produced global samples of forest height and aboveground biomass density, essential for carbon accounting and for distinguishing mature forest from plantations or regrowth. While GEDI is sampling (not wall‑to‑wall imaging), its footprints calibrate models that turn optical/radar imagery into biomass maps.
GIS and cloud computing
Geographic Information Systems (GIS) manage, analyze, and visualize the spatial data. Cloud platforms like Google Earth Engine, Open Data Cube, and commercial geospatial clouds allow analysts to process petabytes of imagery without local infrastructure, enabling global deforestation monitoring pipelines.
AI and machine learning for faster, finer alerts
AI models—especially convolutional neural networks (CNNs) and U‑Net–style architectures—perform image segmentation and change detection at pixel to object scales. They can reduce noise from clouds/shadows, incorporate context (roads, topography), and adapt to regional patterns. Active learning and transfer learning help extend models to new biomes with limited labeled data. Many widely used alert systems are ML‑driven:
- GLAD alerts (University of Maryland/Global Forest Watch): Weekly optical loss alerts from Landsat and Sentinel‑2.
- RADD alerts (Wageningen University & Research): Near-real-time radar-based alerts using Sentinel‑1 for cloud-prone regions.
- INPE DETER (Brazil): Rapid alerts that support enforcement in the Amazon, updated daily using multiple sensors.
For more on the broader AI toolkit in environmental sensing, see AI for Environmental Monitoring: Methods, Use Cases & Tools (/ai-technology/ai-for-environmental-monitoring-methods-use-cases-tools).
Main data sources and technologies at a glance
- Public, free satellites: Landsat (USGS/NASA), Sentinel‑1/2 (ESA), MODIS/VIIRS (NASA/NOAA).
- Commercial imagery: PlanetScope (3–5 m daily), SkySat/Maxar (sub‑meter tasking) for verification and evidence gathering.
- Complementary data: GEDI LiDAR footprints, topography (SRTM/Copernicus DEM), fire detections (VIIRS), road networks, protected area boundaries.
- Platforms and tools: Google Earth Engine, QGIS, PostGIS, Global Forest Watch.
- Alert systems: GLAD (optical), RADD (radar), DETER (Brazil), bespoke national systems (e.g., Indonesia’s SiPongi for fires/peatlands).
Real‑world uses across sectors
Conservation and NGOs
- Rapid response patrols: Weekly radar/optical alerts guide ranger patrols to active clearings. Case studies from the Peruvian Amazon and the Congo Basin show patrols targeted by satellite alerts can dramatically increase the share of illegal activity detected in time to intervene.
- Protected area management: Managers prioritize hotspots and measure whether buffer zones are holding. High-resolution imagery helps distinguish encroachment from permitted community use, reducing conflict.
- Transparency and advocacy: Open data from Global Forest Watch enables watchdog reports on supply chain commitments and protected area infractions, backed by mapped evidence.
Explore broader practices that pair monitoring with on‑the‑ground stewardship in Forest Conservation Strategies: Practical, Science-Based Approaches to Protect, Restore, and Manage (/conservation/forest-conservation-strategies-science-based-protect-restore-manage).
Governments and enforcement agencies
- Real-time enforcement: Brazil’s INPE DETER alerts have long underpinned field operations; deforestation in Brazil’s Legal Amazon fell by about 22% in 2023 compared with 2022 (INPE PRODES), with monitoring and enforcement widely credited as key drivers alongside policy.
- Policy evaluation: National forest agencies assess logging concessions, road expansions, and protected areas by directly measuring outcomes in the imagery.
- Compliance with trade rules: The EU Deforestation Regulation (EUDR) requires commodity traceability to the plot level; satellite data validate that sourcing areas were forest-free after cut-off dates.
Indigenous peoples and local communities
- Territorial defense: Community monitors integrate GLAD/RADD alerts with smartphone GPS and messaging to verify incursions and alert authorities.
- Legal evidence: Time-stamped, georeferenced imagery supports land claims and prosecutions of illegal logging.
- Land-use planning: Communities map customary territories, track regrowth, and design patrol routes more efficiently.
Garmin inReach Mini 2, Lightweight and Compact Satellite Communicator, Hiking Handheld, Orange - 010-02602-00
View on AmazonFor examples of technology-enabled community stewardship, see How Technology Aids Conservation: Sensors, AI, and Renewable Solutions (/sustainability-policy/how-technology-aids-conservation-sensors-ai-renewables).
Researchers and planners
- Trend analysis: Annual global maps (e.g., the University of Maryland’s Global Forest Change) quantify rates and drivers of loss by country and biome.
- Degradation and fire impacts: Radar time series and spectral burn indices separate understory fires from clear-cuts, improving impact estimates.
- Restoration targeting: Identifying abandoned pastures or degraded forests where natural regeneration is likely to succeed at low cost.
For foundational context on drivers and impacts, see Deforestation Explained: Causes, Impacts, and Solutions (/sustainability-policy/deforestation-explained-causes-impacts-solutions).
Benefits and limitations
Benefits
- Speed: Near-real-time alerts narrow the enforcement window from months to days.
- Coverage: Consistent, standardized observations across countries enable apples-to-apples comparisons.
- Cost-effectiveness: Free public imagery (Landsat/Sentinel) and cloud platforms make national monitoring affordable.
- Objectivity and audibility: Methods can be documented and replicated for legal and policy uses.
Limitations
- Cloud cover and smoke: Optical sensors are often blinded in the humid tropics; radar mitigates but requires specialized processing.
- Spatial resolution vs. scale: 10–30 m imagery can miss very small clearings (<0.1 ha). High-res commercial data fill gaps at added cost.
- Algorithm transferability: Models trained in one biome may underperform elsewhere without local calibration.
- False positives/negatives: Changes in seasonality, flooding, or fire scars can mimic loss signals; accuracy assessment is essential.
- Ground verification (ground truth): Field checks or high-resolution visual verification are needed to confirm alerts and improve models. Good-practice accuracy assessment (e.g., Olofsson et al.’s protocols) reports user’s accuracy, producer’s accuracy, and unbiased area estimates.
- Definitions matter: “Tree cover loss” is not the same as permanent deforestation. Plantations, rotational forestry, or storm damage can register as loss but may not be land-use change to non-forest. Clear, policy-relevant definitions are critical.
From monitoring to action: enforcement, policy, restoration, and carbon accounting
- Faster enforcement: Integrating GLAD/RADD/DETER alerts with patrol logistics can cut response times from weeks to days. Several evaluations in the Amazon link alert-driven patrols and embargoes to significant reductions in subsequent clearing in targeted areas.
- Better policy design: Governments can test moratoria, protected status, or concession rules and see changes reflected within the same season, enabling adaptive management.
- Restoration planning: Time series maps reveal where natural regeneration is underway, where fires recur, and where connectivity corridors could yield the biggest biodiversity gains per dollar.
- MRV for carbon markets: Monitoring, Reporting, and Verification (MRV) frameworks use satellite-derived “activity data” (area of loss/gain) combined with “emission factors” (tons of carbon per hectare) from biomass maps and forest inventories. GEDI-enhanced biomass models and wall-to-wall radar/optical composites improve uncertainty bounds—crucial under IPCC guidance for national greenhouse gas inventories and jurisdictional REDD+ programs.

Nikon Forestry Pro II Laser Rangefinder/Hypsometer ...
View on AmazonFor deeper guidance on technology-enabled stewardship and monitoring, explore Using Technology for Environmental Protection: Tools, Impacts, and Practical Guidance (/sustainability-policy/using-technology-for-environmental-protection-tools-impacts-practical-guidance).
By the Numbers
- 10 million hectares: Average annual gross deforestation in 2015–2020 (FAO FRA 2020).
- 10.2 million hectares: Tropical primary forest loss in 2022, emitting ~2.7 Gt CO2 (Global Forest Watch/UMD).
- 22%: Approximate drop in Brazil’s Legal Amazon deforestation in 2023 vs. 2022 (INPE PRODES estimates), aided by active monitoring and enforcement.
- 5–8 days: Typical revisit for Sentinel‑2 and combined Landsat 8/9 at the equator; enables weekly loss alerts.
- ~10 meters: Pixel size of Sentinel‑1/2; can detect clearings roughly 0.1–0.3 ha and larger, depending on context.
- Daily: Operational cadence of Brazil’s DETER alert system; commercial constellations can acquire daily imagery for verification.
- Weeks to days: Reduction in detection latency when using radar-based RADD alerts compared with optical-only pipelines in cloudy regions.
Practical implementation: a minimal workflow
- Define “forest” and study area: Choose thresholds (e.g., canopy cover, height) aligned with policy goals.
- Source imagery: Start with Sentinel‑2/Landsat; add Sentinel‑1 radar for cloudy areas; acquire high-res scenes for verification when needed.
- Preprocess: Cloud/shadow masking (optical), speckle filtering (radar), terrain correction, co-registration.
- Detect change: Apply time series algorithms (e.g., BFAST, CCDC), ML segmentation, or thresholded indices (NBR, NDVI) tuned with local samples.
- Validate: Stratified sample of alerts verified against high-res or field data; compute unbiased area estimates and accuracy metrics.
- Act: Push alerts to rangers, prosecutors, or supply-chain teams with coordinates, size, and age; track responses in a case management system.
- Iterate: Incorporate feedback from the field and update training data and thresholds.
Accuracy, costs, and data governance
- Accuracy: Peer-reviewed validations of global alert products report high precision in many regions but variable recall for small clearings and degradation. Combining optical and radar generally boosts detection rates and reduces weather-related gaps.
- Costs: Public data and cloud tools keep core monitoring affordable; major costs include staff time, ground verification, and high-resolution imagery for legal evidence. The NICFI program significantly lowers verification costs in the tropics.
- Data governance and ethics: Work with Indigenous and local communities to respect data sovereignty. Public alert maps can create risks if not paired with community consent and safeguards.
Where the technology is heading
- Fusion and harmonization: Routine blending of optical, radar, and LiDAR will yield more reliable, wall-to-wall maps of loss, degradation, and biomass change.
- Degradation detection: L‑band radar and improved time series methods will make selective logging and understory fires more visible.
- Probabilistic alerts: Instead of binary flags, alerts will carry uncertainty estimates that guide triage and legal confidence.
- Edge analytics and automation: Cloud pipelines will auto-generate cases, task high-res satellites, and route incidents to patrol apps within hours of detection.
- Policy integration: Commodity traceability systems (e.g., for soy, beef, palm oil, cocoa) will increasingly require parcel-level geolocation backed by satellite records, mainstreaming monitoring in corporate due diligence.
Satellite monitoring deforestation has already reshaped how we track and respond to forest loss. The combination of open data, radar that sees through clouds, LiDAR-informed biomass models, and AI that sifts signals from noise is giving policymakers, companies, and communities a shared, near-real-time picture of what’s happening in the world’s forests—and a faster path to act on it.
Recommended Products
Introduction to Remote Sensing: Campbell, James B., Wynne, Randolph H., Thomas, Valerie A.
Now in full color, the sixth edition ... features <strong>new chapters on remote sensing platforms (including the latest satellite and unmanned aerial systems), agriculture (including agricultural ana
Garmin inReach Mini 2, Lightweight and Compact Satellite Communicator, Hiking Handheld, Orange - 010-02602-00
Garmin inReach Mini 2 Satellite Communicator, Lightweight Compact Rugged Design, Portable GPS Handheld for Hiking, Two-Way Text Messaging Device Bundle with Accessories (Flame Red)
Nikon Forestry Pro II Laser Rangefinder/Hypsometer ...
Check each product page for other buying options. Price and other details may vary based on product size and color · National Audubon Society Trees of North America (National Audubon Society Complete
More in AI & Technology
- How Technology Aids Conservation: Sensors, AI, and Renewable Solutions
- Deforestation Explained: Causes, Impacts, and Solutions
- Forest Conservation Strategies: Practical, Science-Based Approaches to Protect, Restore, and Manage
- Using AI for Habitat Conservation: Practical Applications, Data Needs, and Ethical Implementation