Disadvantages of Solar Energy: Costs, Limits, and Environmental Trade-offs
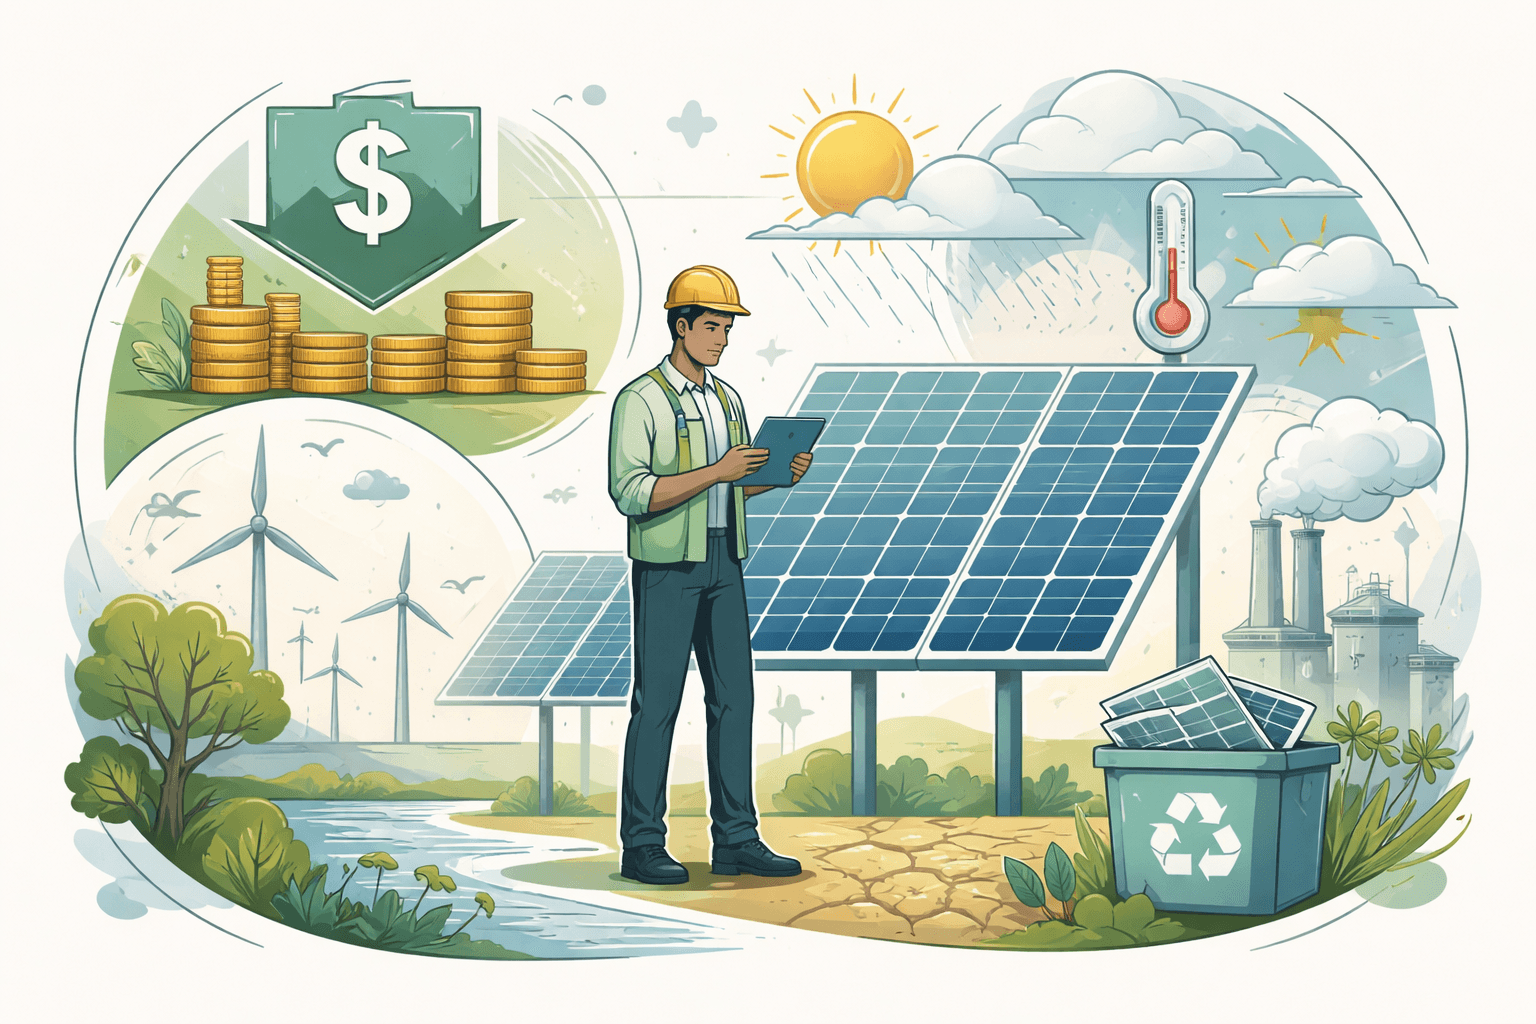
Solar has raced ahead: the IEA estimates the world added roughly 445 GW of solar PV in 2023 alone, more than all other generation types combined. But for all its climate and cost benefits, the disadvantages of solar energy are real and worth understanding before you invest or plan a grid transition. If you need a refresher on how solar works and where the savings come from, see our explainer: Solar Power Explained: How It Works, Costs, and Climate Benefits.
What are the disadvantages of solar energy? Quick answer
- High upfront cost: Even after incentives, a typical U.S. residential system still runs $12,000–$25,000 out of pocket.
- Variable output and intermittency: Solar only generates when the sun shines, creating reliability and “duck curve” challenges for grids.
- Lower value without supportive policies: Changes to net metering or export rates can lengthen payback periods by years.
- Land and siting trade-offs: Utility-scale PV uses 5–10 acres per MWac and can fragment habitat without careful siting; rooftop can raise aesthetic concerns.
- Material and lifecycle impacts: Manufacturing is energy- and material-intensive; end-of-life recycling systems are still scaling.
- Performance limits: Panel efficiency tops out around 20–23% commercially; output drops with heat, soiling, snow, and shading.
- Supply-chain concentration and policy risk: 80–95% of key solar components are made in China; tariffs and trade actions can swing prices.
SOLAR POWER FINANCE WITHOUT THE JARGON: Jenny Chase
At its core the book <strong>contains detailed analysis of the history, technology, economics, finance, and business practices of the photovoltaics industry and her views on its prospects</strong>.
Check Price on AmazonBy the numbers: the downsides in context
- 0% capacity at night; cloudy conditions can cut output by 60–90% relative to clear-sky noon.
- Typical U.S. utility-scale solar capacity factor is ~24–26% (EIA), versus ~85–95% for nuclear and ~50–60% for combined-cycle gas.
- California curtailed more than 2.6 TWh of renewable generation in 2023, mostly midday solar, due to grid constraints (CAISO).
- Median residential installed price in the U.S. was about $3.8/Wdc for 2023 systems (LBNL “Tracking the Sun 2024”).
- Global PV supply chain: ~95% of wafers and ~80%+ of cells are produced in China (IEA).
- Lifecycle emissions: utility-scale PV ~20–50 gCO2e/kWh; onshore wind ~10–20; coal ~800–1,000 (IPCC/NREL ranges).
Economic drawbacks — upfront costs, return on investment, and incentives
For households and small businesses, the most immediate disadvantage of solar energy is the upfront cost. In the U.S., Lawrence Berkeley National Laboratory (LBNL) reports a median installed price of roughly $3.8 per watt (direct current) for residential systems installed in 2023. That implies:
- 6 kW system: ~$22,800 before incentives
- 8 kW system: ~$30,400 before incentives
Federal policy currently softens the blow: the Investment Tax Credit (ITC) is 30% through 2032 under the Inflation Reduction Act, stepping down to 26% in 2033 and 22% in 2034. After the ITC, the net cost of that 8 kW system could be closer to ~$21,300—still a large check to write.
Payback periods vary widely by location, electricity prices, and policy. Here are two simplified scenarios to illustrate how value can swing.
High-rate, sunny scenario (fast payback)
- System: 7 kW at $3.5/Wdc = $24,500
- Net cost after 30% ITC: $17,150
- Annual output: ~1,400 kWh/kW-year = 9,800 kWh (Southwest U.S. typical)
- Retail electricity price: $0.20/kWh
- Annual bill offset: 9,800 × $0.20 = $1,960
- Simple payback: $17,150 / $1,960 ≈ 8.7 years (ignoring performance degradation, rate escalation, O&M)
Low-rate, cloudy scenario (slow payback)
- System: 7 kW at $3.8/Wdc = $26,600
- Net cost after 30% ITC: $18,620
- Annual output: ~1,100 kWh/kW-year = 7,700 kWh (Northeast U.S. typical)
- Retail electricity price: $0.12/kWh
- Annual bill offset: 7,700 × $0.12 = $924
- Simple payback: $18,620 / $924 ≈ 20.2 years
These examples underscore three key disadvantages:
- Local conditions drive outcomes: Insolation and retail rates are destiny for rooftop solar economics.
- Policy exposure matters: If export compensation for excess power falls well below retail value (as in California’s shift to “NEM 3.0”), paybacks lengthen unless paired with batteries or load shifting.
- Finance costs add up: Loans turn the upfront hit into monthly payments but add interest; leases/PPAs lower upfront cost while locking you into long-term contracts, which can complicate home sales.
Other economic considerations often overlooked:
- Inverter replacement: Most string inverters last ~10–15 years and can cost $1,000–$3,000 to replace; microinverters often have longer warranties but higher upfront costs.
- Roof condition: If your roof needs replacement within 5–10 years, coordinating projects can add $6,000–$15,000 to total cost.
- Operations and maintenance: In low-soiling climates, O&M is modest; in dusty or snowy regions, periodic cleaning can be necessary to maintain yield.
For a broader look at trade-offs beyond the dollars, see our Solar Panels Pros and Cons: A Data-Driven Guide.
Intermittency, reliability, and grid integration challenges
Solar’s output follows the sun: zero at night, variable through the day, and heavily influenced by weather. At the grid scale, this creates several disadvantages:
- The duck curve: Midday solar surges push down net load, followed by steep evening ramps as solar wanes and demand remains high. This requires fast-ramping resources (gas, hydropower, batteries) and can stress systems.
- Curtailment: When transmission is constrained or supply exceeds demand, grid operators order some solar to be turned down. CAISO reported more than 2.6 TWh of renewable curtailments in 2023, up sharply as solar expanded.
- Capacity value declines with penetration: The reliability contribution of an additional megawatt of solar diminishes as more solar comes online, because output is highly correlated across plants. The first increments replace expensive midday peakers; later increments face curtailment and lower prices.
- Locational challenges: Many of the sunniest sites are far from load centers. Transmission additions have not kept pace, and interconnection queues are long and uncertain, with median wait times around five years for new generation projects in recent analyses (LBNL’s “Queued Up”).
Storage is mitigating these issues—U.S. grid-scale battery capacity is expected to exceed 30 GW around 2024–2025 (EIA)—but not without cost. Batteries add capital expense, have finite lifetimes, and introduce their own supply-chain constraints.
Environmental and material impacts — manufacturing, rare materials, lifecycle emissions, and end-of-life disposal
Compared with fossil fuels, solar’s lifecycle emissions are low. Meta-analyses from the IPCC and NREL place utility-scale PV around 20–50 grams of CO2-equivalent per kWh, versus 800–1,000 g for coal and ~400–500 g for modern gas. That said, several environmental trade-offs warrant attention:
- Energy- and carbon-intensive manufacturing: Polysilicon production and ingot/wafer processing are electricity-hungry. Because the PV supply chain is concentrated in East Asia, the carbon intensity of local grids matters; coal-heavy regions inflate embodied emissions, while factories in hydropower-rich provinces lower them.
- Materials: Standard crystalline silicon modules use aluminum frames, tempered glass, copper, encapsulants, and small amounts of silver in cell metallization. Industry has reduced silver loading by more than half over the past decade, but silver remains a supply pressure point. Thin-film technologies like cadmium telluride (CdTe) and CIGS swap silver for other critical elements (tellurium, indium, gallium), which are byproduct metals with constrained supply growth.
- Chemicals and waste: Manufacturing involves acids and solvents that must be managed responsibly; reputable producers operate under ISO and national environmental standards, but weak enforcement in some regions has led to local impacts.
- End-of-life management: Most panels carry 25–30-year performance warranties, so the first large retirement wave is ahead. IEA PVPS has estimated cumulative global PV waste in the millions of tons by 2030, rising to tens of millions by 2050. The EU requires PV recycling under WEEE rules; the U.S. lacks a federal framework, though some states (e.g., Washington) have manufacturer stewardship programs. Today’s recycling costs can run $15–$45 per panel, and capacity is still scaling.
The takeaway: solar’s lifecycle footprint is small compared with fossil electricity, but not zero. Responsible procurement (e.g., low-carbon polysilicon, audited factories) and robust recycling ecosystems are essential to minimizing environmental downsides.
Land use, aesthetics, and ecological impacts (utility-scale vs rooftop trade-offs)
Utility-scale PV requires land. NREL studies suggest fixed-tilt solar commonly uses 5–10 acres per MWac, depending on design and topography. At national scales, that is a tractable footprint—well under 1% of U.S. land area for very high solar penetration—but siting matters:
- Habitat fragmentation: Poorly sited projects can disturb sensitive ecosystems (e.g., desert tortoise habitats in the U.S. Southwest). Early, science-based siting and mitigation plans are critical.
- Agrivoltaics and dual use: Co-locating PV with low-height crops or grazing can maintain agricultural productivity and improve soil moisture, partially offsetting land-use concerns.
- Visual impact: Ground-mounted arrays change local vistas; glare concerns near airports and highways require assessment, though modern panels are engineered to absorb rather than reflect light.
Rooftop solar avoids new land use but raises other issues:
- Aesthetics and HOA rules: Some homeowners or neighborhoods resist visible arrays, though “solar access” laws in many states limit HOA restrictions.
- Structural limitations: Older roofs may lack the structural margin for certain mounting approaches; tree removal to reduce shading can carry ecological and community trade-offs.
Technical limitations — efficiency, degradation, performance in different climates and on cloudy days
- Efficiency ceilings: Commercial silicon modules typically deliver 20–23% efficiency; single-junction theoretical limits (the Shockley–Queisser limit) are ~33%. Tandem perovskite–silicon cells have exceeded 30% in the lab, but mass-market deployment is still emerging.
- Degradation: Field data compiled by NREL place median module degradation historically around 0.5% per year, with modern mono-PERC/TOPCon closer to 0.2–0.4% per year. Over 25 years, that can trim lifetime energy by ~5–12%.
- Temperature effects: Silicon modules lose output as they heat up. Typical temperature coefficients are around −0.35% per °C above 25°C module temperature, meaning hot climates see nontrivial performance penalties without adequate airflow.
- Weather and soiling: Snow, dust, pollen, and bird droppings cut output; heavy clouds can reduce instantaneous production by 60–90% relative to clear conditions. In windy, dusty regions or where pollen loads are high, periodic cleaning improves yield. Our Solar Panel Maintenance Tips outline simple steps and when they pay off.
- Shading and orientation: Even partial shading can disproportionately reduce output, though module-level power electronics (MLPE) like microinverters mitigate losses. Roofs that face east–west will generate less midday energy than south-facing (north-facing in the Southern Hemisphere), shifting the value proposition.
- Capacity factor: Location determines annual output. Germany’s PV fleet averages around 11–12% capacity factor due to latitude and climate, while U.S. utility-scale plants often reach 24–26% and the sunniest sites exceed 30%.
These technical realities don’t negate solar’s usefulness but they bound expectations. Good system design and realistic production modeling are non-negotiable.
Policy, regulatory, and supply-chain risks (tariffs, incentive changes, mining and geopolitics)
- Tariffs and trade actions: The U.S. has imposed antidumping/circumvention tariffs on certain Asian-made components; enforcement under the Uyghur Forced Labor Prevention Act (UFLPA) has also detained shipments tied to high-risk polysilicon. Results: price volatility, delivery delays, and batch-by-batch traceability requirements.
- Incentive cliffs: The 30% federal ITC lasts through 2032, but step-downs begin in 2033. State and utility incentives swing with politics and budgets; sudden net-metering changes can reshape residential economics (e.g., California’s NEM 3.0 export rates, which broadly reduced daytime export compensation relative to retail rates).
- Interconnection bottlenecks: LBNL’s queue studies show thousands of gigawatts stuck in U.S. queues, with median wait times around five years. Upgrade costs can be unpredictable, especially in congested nodes.
- Supply concentration: IEA estimates ~95% of wafer production and a dominant share of cell/module manufacturing occur in China. Geopolitical tensions, export controls, or domestic industrial policy in the U.S. and EU could reprice modules or shift availability. While global module spot prices fell below $0.15/W in 2023–2024 due to oversupply, U.S. prices remain higher because of tariffs, logistics, and compliance costs.
- Critical minerals and sustainability: Silver, copper, aluminum, and specialty elements for thin films and batteries invite mining impacts. Ethical sourcing and recycling are essential to avoid externalizing harms to mining regions.
Mitigation strategies and when solar still makes sense — storage, hybrid systems, recycling, policy solutions, and a decision checklist
Solar’s disadvantages are manageable with planning and the right complements. Consider these strategies:

ecobee Smart Thermostat Premium with Smart Sensor and Air Quality Monitor - Programmable Wifi Thermostat - Works with Siri, Alexa, Google Assistant - Amazon.com
View on Amazon
EF ECOFLOW Portable Power Station 3600Wh DELTA Pro, 120V AC Outlets x 5, 3600W, 2.7H Fast Charge, Lifepo4 Power Station, Solar Generator for Home Use, Power Outage, Camping, RV, Emergencies : Patio, Lawn & Garden
<strong>Fully recharge the lifepo4 battery in 1.8 hrs with 240V outlets(3000W), 2.7 hrs with 1800W wall outlets or solar charged in 2.8 hours with 4*400W solar panels</strong> thanks to the industry-l
Check Price on Amazon- Pair solar with storage where export rates are low: Batteries time-shift excess midday generation to evening, improving self-consumption under reduced export compensation regimes. While batteries add cost and degrade over time, falling prices and incentives can pencil out in high-rate markets.
- Load flexibility and rate design: Smart thermostats, EV charging timers, and water heaters can shift consumption to sunny hours. Time-of-use rates reward alignment and reduce duck-curve stress.
- Smarter siting and design: West-tilted arrays can better cover evening peaks in some markets. Module-level power electronics reduce shading losses; proper ventilation cuts temperature losses.
- Diversify technologies: Hybrid systems that include wind or community-shared solar can smooth variability. If you’re comparing resource mixes, see our analysis: Is Wind Energy Better Than Solar? A Data-Driven Comparison.
- Responsible procurement: Favor suppliers with third-party audits, low-carbon polysilicon sourcing, and robust environmental, labor, and quality controls.
- Plan for end of life: Choose installers that offer take-back or partner with recyclers; keep documentation of panel models and serials for future processing.
- Policy solutions: Streamlined interconnection, more transmission, dynamic pricing, and well-designed incentives reduce curtailment and improve grid value. Producer-responsibility laws can fund recycling without burdening consumers.
Decision checklist for homeowners and small businesses
- Your electricity rate: Above ~$0.18–$0.20/kWh? Solar is more likely to pay back quickly; below ~$0.12/kWh, scrutinize payback.
- Solar resource: How many kWh/kW-year does your roof model predict? Request production estimates with shading analysis.
- Export rules: What does your utility pay for exports? Retail, avoided cost, or wholesale? Are there minimum bills or fixed charges?
- Roof and load fit: Will you need a roof replacement soon? Do you have daytime loads (EV charging, heat pumps, pool pumps) that align with solar generation?
- Financing: Can you secure low-interest financing or use cash? Compare total lifetime costs for cash, loans, leases, and PPAs.
- Resilience: Do you need backup power? Batteries add resilience during outages but increase cost.
- Installer quality: Seek NABCEP-certified installers, strong workmanship warranties, and clear O&M plans. For the broader context on technology choices, our Solar Panels Pros and Cons and Solar Power Explained provide additional detail.
Where the technology is heading
- Higher efficiencies: Tandem perovskite–silicon cells are moving from labs to pilot lines, promising >25% commercial modules within a few years, which would reduce area-related costs and BOS (balance-of-system) impacts.
- Less silver, more alternatives: Cell architectures like TOPCon and HJT are cutting silver usage further; copper plating is in development, easing material constraints.
- Smarter grids and more storage: Scaling batteries (including behind the meter), flexible loads, and better market designs are already increasing the effective capacity value of solar.
- Domestic manufacturing: The U.S. and EU are investing to diversify supply chains with incentives, which could reduce tariff exposure and improve traceability.
Solar’s growth won’t slow because the benefits—especially emissions reductions and long-run cost stability—are compelling. But understanding the disadvantages of solar energy helps you design smarter systems, write better policies, and set realistic expectations. If you want to dig into fundamentals or compare against other resources, explore our Solar Power Explained guide.
Recommended Products
SOLAR POWER FINANCE WITHOUT THE JARGON: Jenny Chase
At its core the book <strong>contains detailed analysis of the history, technology, economics, finance, and business practices of the photovoltaics industry and her views on its prospects</strong>.
EF ECOFLOW Portable Power Station 3600Wh DELTA Pro, 120V AC Outlets x 5, 3600W, 2.7H Fast Charge, Lifepo4 Power Station, Solar Generator for Home Use, Power Outage, Camping, RV, Emergencies : Patio, Lawn & Garden
<strong>Fully recharge the lifepo4 battery in 1.8 hrs with 240V outlets(3000W), 2.7 hrs with 1800W wall outlets or solar charged in 2.8 hours with 4*400W solar panels</strong> thanks to the industry-l
ecobee Smart Thermostat Premium with Smart Sensor and Air Quality Monitor - Programmable Wifi Thermostat - Works with Siri, Alexa, Google Assistant - Amazon.com
ecobee Smart Thermostat Premium with Smart Sensor and Air Quality Monitor - Programmable Wifi Thermostat - <strong>Works with Siri, Alexa, Google Assistant</strong> - Amazon.com
More in Renewable Energy
- Solar Power Explained: How It Works, Costs, and Climate Benefits
- The Environmental Impact of Solar Energy: Lifecycle Footprint, Trade-offs, and Practical Solutions
- Solar Panels Pros and Cons: A Data-Driven Guide to Decide If They’re Right for You
- Green Energy Explained: Types, Benefits, and How to Adopt It