What Is Renewable Energy? Types, Benefits, and How Solar Fits In
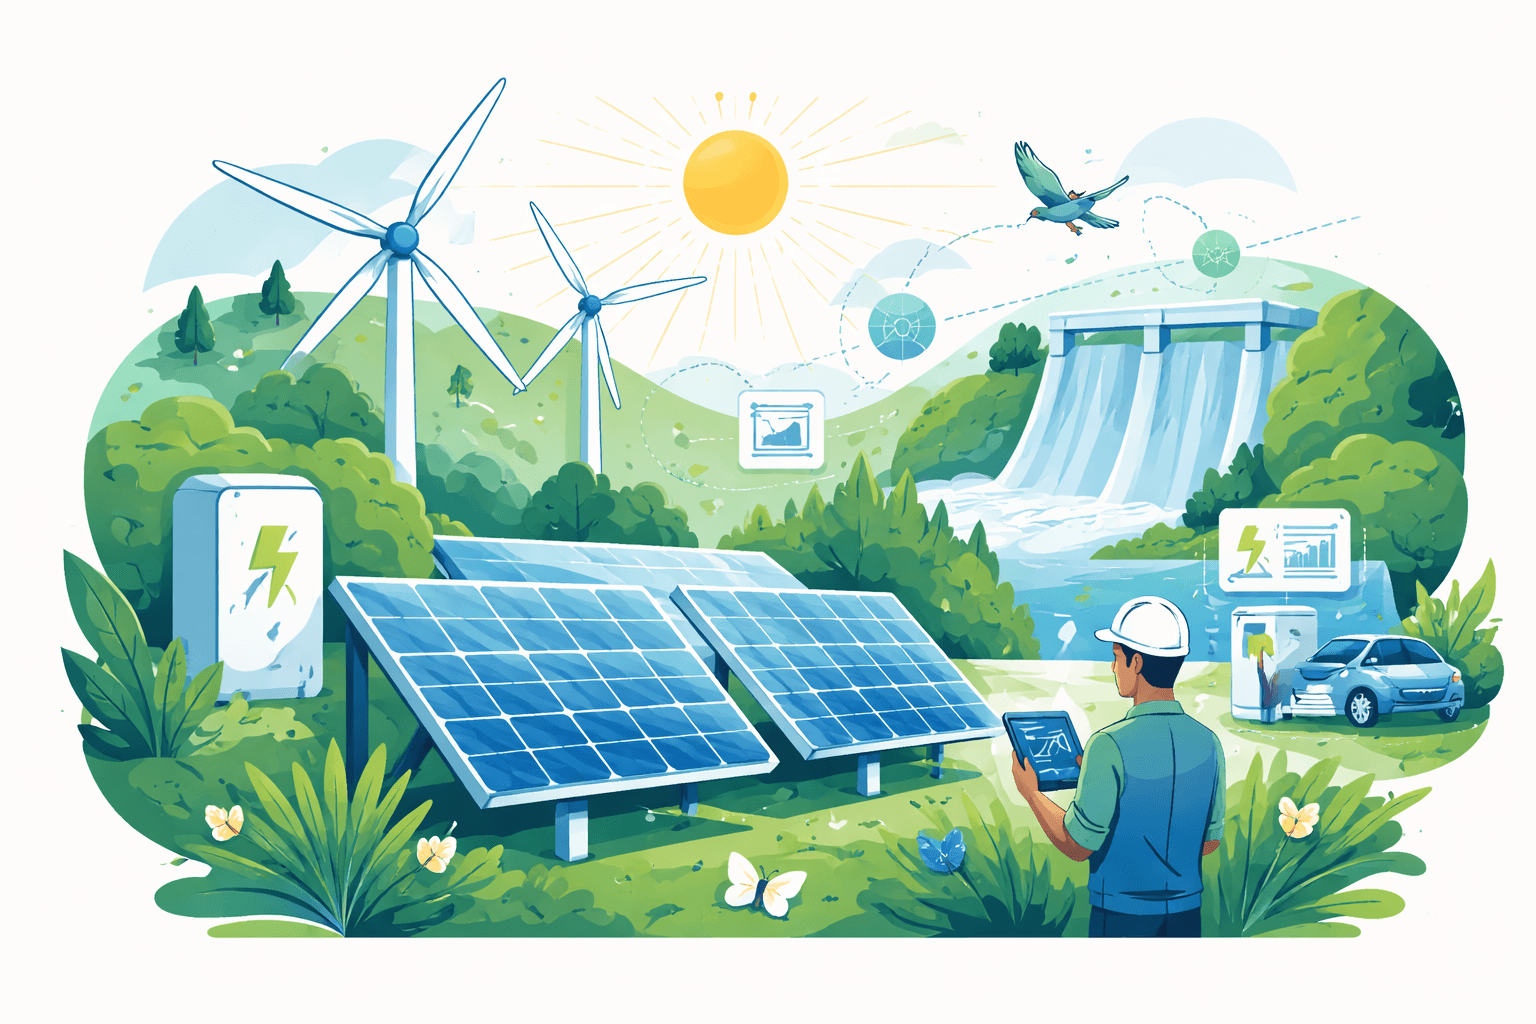
A record-setting year made the definition more urgent: according to the International Renewable Energy Agency (IRENA), more than 470 GW of renewable power capacity was added in 2023—roughly 86% of all new global power capacity. If you’re asking what is renewable energy, it’s not just an abstract concept. It’s now the dominant source of new power worldwide, led by solar photovoltaics (PV) and wind.
This guide explains what renewable energy is, how the main types work, how costs and emissions compare to fossil fuels, and why solar plays an outsized role. We’ll also unpack common myths, practical ROI, incentives, and future trends shaping adoption.
What Is Renewable Energy?
Renewable energy is energy derived from natural processes that are replenished at a rate equal to or faster than they are consumed. This includes solar radiation, wind, water flow, geothermal heat, and biological growth. In power markets, renewable electricity typically refers to solar, wind, hydropower, geothermal, and sustainably sourced biomass.
Sustainable Energy - without the hot air: MacKay, David JC
Written by David MacKay, who was an esteemed Professor of Engineering at the University of Cambridge and Chief Scientific Advisor to the UK Department of Climate Change, this is <strong>an uplifting,
Check Price on AmazonTwo key ideas help make this precise:
- Resource renewability: The primary energy input—sunlight, wind, water flow, geothermal heat, or biomass feedstocks—replenishes naturally on human-relevant timescales.
- Lifecycle emissions: While devices (panels, turbines, dams) require materials and manufacturing, their total greenhouse gas (GHG) emissions over the full lifecycle are far lower than fossil fuels, according to the IPCC’s centralized estimates.
For a broader primer on clean sources, see Renewable Energy Sources: A Clear Guide to Solar, Wind & More (/renewable-energy/renewable-energy-sources-guide) and Green Energy Explained: Types, Benefits, and How to Adopt (/sustainability-policy/green-energy-explained-types-benefits-how-to-adopt).
Main Types of Renewable Energy
Solar energy
- What it is: Converts sunlight into electricity via photovoltaics (PV) or concentrates solar heat with mirrors (CSP).
- Scale today: Solar PV is the fastest-growing power technology. Global cumulative PV capacity surpassed 1 TW in 2022 and exceeded 1.4 TW by end-2023, with more than 400 GW added in 2023 alone (IEA; IRENA; BloombergNEF).
- Use cases: Rooftop and community solar (distributed), plus utility-scale solar farms; CSP with thermal storage in high-irradiance regions.
- Performance: Typical capacity factor—percentage of time a plant generates at rated output—ranges ~18–26% for PV depending on location and design. Bifacial panels and single-axis tracking raise yields.
Wind energy
- What it is: Turbines convert wind’s kinetic energy into electricity.
- Scale today: 2023 was a record year with ~117 GW of new wind capacity (Global Wind Energy Council), bringing global wind to over 1 TW.
- Use cases: Onshore wind dominates on cost and scale; offshore wind offers higher capacity factors (often 40–55%) and proximity to coastal load centers.
Hydropower
- What it is: Uses falling or flowing water to spin turbines. Includes reservoir, run-of-river, and pumped storage.
- Scale today: Hydropower remains the largest source of renewable electricity globally, with well over 1.2 TW installed (International Hydropower Association; IRENA).
- Use cases: Bulk, dispatchable generation; pumped storage provides grid-scale energy storage—still more than 90% of the world’s stored electricity capacity.
Geothermal energy
- What it is: Taps Earth’s internal heat for baseload electricity and direct heat. Power plants use high-temperature resources; heat pumps electrify space and water heating.
- Scale today: Global geothermal power capacity is on the order of 16–17 GW (IRENA), while heat pumps are surging—with global sales up ~11% in 2022 (IEA).
- Use cases: Baseload and flexible power in geothermally active regions; district heating and industrial process heat.
Biomass energy
- What it is: Converts organic material (agricultural residues, energy crops, biogas from landfills or anaerobic digestion) into electricity, heat, or fuels.
- Scale today: Biomass power capacity exceeds 140 GW globally (IRENA). Lifecycle GHG performance depends on feedstock, land-use change, and combustion technology (IPCC).
- Use cases: Combined heat and power; biogas for dispatchable generation; renewable fuels. Sustainability criteria are critical to ensure net climate benefits.
How Renewable Energy Differs from Fossil Fuels
Emissions and climate impact
Peer-reviewed meta-analyses compiled by the IPCC show median lifecycle GHG emissions (gCO2e/kWh) of roughly:
- Wind: ~12
- Solar PV: ~48
- Hydropower: ~24 (wider range depending on reservoirs)
- Geothermal: ~38
- Biomass: highly variable, dependent on feedstock and accounting boundaries
- Natural gas: ~490 (including combustion, not always methane leakage)
- Coal: ~820
These numbers account for mining, manufacturing, construction, operation, and decommissioning. Even when considering materials and supply chains, renewables’ lifecycle emissions are a fraction of fossil fuels.
Intermittency and dispatchability
- Variability: Solar and wind are variable; output depends on weather and time of day. Grid operators manage this with forecasting, geographic diversity, flexible demand, and storage.
- Storage growth: BloombergNEF estimates global energy storage deployments reached about 42 GW/99 GWh in 2023, with strong growth expected. In the U.S., grid-scale batteries surpassed the mid-teens in GW by 2024 (EIA), increasingly shifting solar from day to night.
- Firming resources: Hydropower, geothermal, demand response, and low-carbon firm power (e.g., long-duration storage, green hydrogen, advanced geothermal) complement variable renewables.
Cost trends
Lazard’s 2024 Levelized Cost of Energy analysis finds unsubsidized LCOEs roughly in these ranges (USD/MWh):
- Utility-scale solar PV: ~$24–$96
- Onshore wind: ~$28–$75
- Gas combined cycle: ~$39–$101
- New coal: ~$68–$166
Costs vary by location, financing, and resource quality, but utility-scale solar and wind are now among the cheapest new-build options globally.
Lifecycle and ecological impacts
- Materials: Renewables need metals (copper, aluminum), minerals (lithium, nickel), and land. Responsible mining, recycling, and circular design are scaling. PV modules and wind turbine blades are increasingly targeted by recycling initiatives.
- Land and wildlife: NREL estimates utility-scale PV typically uses ~5–10 acres per MWac (about 2–4 hectares). Onshore wind spatially spans ~30–50 acres per MW, but only ~1–2% is permanently disturbed—the rest remains compatible with farming or grazing. Siting and mitigation (avian-safe siting, fish passage for hydro) matter for biodiversity outcomes.
The Role of Solar Power in the Transition
Solar is the workhorse of new renewable additions for three reasons: steep cost declines, modularity from rooftops to gigawatt-scale plants, and rapid technology improvements.
EF ECOFLOW Solar Generator DELTA 2 with 220W Solar Panel, 1024Wh LFP(LiFePO4) Battery, 1800W AC/100W USB-C Output, Fast Charging Portable Power Station for Home Backup Power, Camping & RVs : Patio, Lawn & Garden
Clean, Green Charging. With up to 500W of solar panel input, DELTA 2 is a solar generator that can be charged while camping, on an RV trip or off-grid. <strong>Includes a 220W Bifacial solar panel to
Check Price on Amazon- Deployment: Solar PV supplied roughly 5–6% of global electricity in 2023 (Ember), but represented the majority of new capacity additions. Many markets now see PV as the lowest-cost source for daytime power.
- Costs: IRENA reports the global weighted-average LCOE of utility-scale PV fell ~89% from 2010 to 2022, driven by manufacturing scale, module efficiency gains, and optimized balance-of-system costs.
- Technology: Commercial module efficiencies of 21–23% are common with TOPCon and heterojunction (HJT); bifacial panels on single-axis trackers boost yields at utility scale. Lab cells have surpassed 33% in tandem perovskite–silicon configurations (NREL best research-cell chart), indicating future room for improvement.
- Segments:
- Residential: Rooftop PV paired with smart inverters and optional batteries improves bill savings and resilience. Typical paybacks in favorable U.S. markets are 6–10 years (varies widely by rates, incentives, and roof).
- Commercial/industrial: Behind-the-meter solar cuts demand charges and hedges electricity price volatility; rooftop and carport PV are common.
- Utility-scale: Large solar farms deliver very low LCOE; pairing with 1–4 hours of batteries enables evening peak coverage and reduces curtailment.
For a deeper dive, see Solar Power Explained: How It Works, Costs, and Climate Benefits (/renewable-energy/solar-power-explained-how-it-works-costs-climate-benefits) and The Complete Guide to Solar Energy: How It Works, Costs, and Benefits (/renewable-energy/complete-guide-solar-energy-how-it-works-costs-benefits).
By the Numbers: Renewable Energy in 2023–2025
470 GW renewable capacity added in 2023; renewables were ~86% of global net additions (IRENA 2024).
- ~117 GW wind added in 2023, the industry’s best year to date (GWEC 2024).
- Solar PV additions exceeded 400 GW in 2023 by several major analyses (IEA; IRENA; BloombergNEF).
- Wind + solar generated ~13–14% of global electricity in 2023 (Ember 2024), with total renewables supplying roughly a third of power.
- Lithium-ion battery pack prices averaged ~$139/kWh in 2023, down ~14% year-over-year (BloombergNEF).
- Renewable energy employment reached ~13.7 million jobs in 2022, led by ~4.9 million in solar PV (IRENA/ILO 2023).
- Lifecycle emissions medians (IPCC): wind ~12 gCO2e/kWh, PV ~48, hydro ~24, gas ~490, coal ~820.
Environmental and Economic Benefits
- GHG reductions: Displacing coal and unabated gas with wind and solar delivers large near-term emissions cuts, central to 1.5°C pathways (IEA Net Zero).
- Health: The World Health Organization attributes millions of premature deaths annually to air pollution; replacing coal and oil with renewables reduces sulfur dioxide, nitrogen oxides, and particulate matter.
- Jobs and local economies: Construction, installation, operations, and supply chains generate local employment; IRENA counts 13.7 million renewable jobs in 2022, with rapid growth concentrated in solar manufacturing and installation.
- Consumer savings: As low-cost resources, renewables dampen wholesale prices during high-output periods; storage helps shift that value to peaks. Behind-the-meter solar reduces bills and provides resilience when paired with batteries.
- LCOE advantage: As shown by Lazard 2024, new utility-scale wind and solar often beat new fossil plants on cost, even before incentives. Long-run fuel price volatility also favors zero-fuel renewables.
Common Myths and FAQs about Renewable Energy
“Renewables aren’t reliable.” Grid operators already run high-renewables systems by combining forecasting, flexible demand, geographic diversity, interregional transmission, and storage. Denmark and parts of Spain and Portugal regularly see days near or above 100% wind and solar generation while maintaining reliability.
“You need days of storage to run a grid.” Most balancing needs are intra-day. 1–4 hours of battery storage addresses the bulk of solar shifting; wind variability is mitigated with diverse siting, demand response, and limited-duration storage. Seasonal balancing is a longer-term challenge, addressed by hydropower reservoirs, interconnection, thermal storage, and emerging long-duration storage. See Energy Storage Explained: Types, Costs, and How It Powers the Grid (/ai-technology/energy-storage-explained-types-costs-grid).
“Solar and wind take too much land.” NREL data show PV typically uses ~5–10 acres/MWac. Co-location strategies (agrivoltaics, pollinator-friendly ground cover) preserve habitat and farm output. Wind’s physical footprint permanently disturbs ~1–2% of its project area; most land remains usable for agriculture.
“Biomass is carbon neutral.” Not necessarily. Climate benefit depends on feedstock, land-use change, and timeframes. Using true wastes and residues and avoiding deforestation are key to achieving net GHG reductions (IPCC).
“Manufacturing PV and batteries cancels climate gains.” Lifecycle analyses consistently show that even after accounting for materials and manufacturing, wind and solar have an order-of-magnitude lower emissions than fossil power. As supply chains decarbonize and recycling scales, lifecycle impacts fall further.
How to Evaluate Renewable Options for Your Home or Community
Incentives and policies to know (U.S.-focused example)
- Federal tax credits: The Investment Tax Credit (ITC) offers 30% for residential solar and eligible standalone storage through at least 2032, with potential “adder” bonuses for low-income, domestic content, or energy community siting (consult IRS guidance or a tax professional).
- Net metering / net billing: State-regulated programs credit exported solar generation at retail or a set export rate. Program design heavily influences payback.
- Community solar: Offsite shared solar subscriptions let renters and shaded-roof homeowners participate; savings typically 5–20% versus utility rates depending on state program rules.
- Grants and rebates: Local and utility programs may offer additional rebates for heat pumps, solar, storage, or efficiency upgrades.
Simple payback example (illustrative)
- System: 7 kW rooftop PV
- Installed price (before incentives): $2.50/W → $17,500
- Federal ITC (30%): −$5,250 → Net cost $12,250
- Annual output: ~9,800 kWh (varies by location; assume good sun and minimal shading)
- Utility energy rate offset: $0.20/kWh
- Annual bill savings: ~$1,960
- Simple payback: ~$12,250 / $1,960 ≈ 6.2 years
Your numbers will vary based on local sun (insolation), roof conditions, equipment, labor, interconnection costs, export credit design, and rate structures (time-of-use, demand charges). Many homeowners see 6–10 year simple paybacks; businesses often stack accelerated depreciation and demand charge reduction for compelling returns.
Decision checklist
- Energy profile: Know your annual kWh usage, peak demand, and rate plan.
- Roof/site: Orientation, tilt, shading, and structural condition; available ground for carports or ground-mounts.
- Tariffs and policies: Net metering/net billing rules, fixed charges, demand charges, interconnection timelines.
- Incentives: Federal, state, local, and utility rebates/credits; low-income or community incentives.
- Resilience needs: Consider batteries for outage protection; right-size duration to critical loads.
- Financing: Cash, loans, leases/PPAs; compare lifetime bill savings and escalators.
- Vendor diligence: Multiple quotes, equipment specs (module efficiency, inverter features), warranties, and installer track record.

Emporia Gen 2 Smart Home Energy Monitor with 16 50A Circuit Level Sensors | Real Time Electricity Monitor/Meter | Solar/Net Metering - Amazon.com
View on AmazonFor foundations on how PV works and what affects economics, see Solar Power Explained: How It Works, Costs, and Climate Benefits (/renewable-energy/solar-power-explained-how-it-works-costs-climate-benefits) and The Complete Guide to Solar Energy: How It Works, Costs, and Benefits (/renewable-energy/complete-guide-solar-energy-how-it-works-costs-benefits).
Future Trends and Policy Drivers
- Storage scaling and diversification: Lithium-ion dominates short-duration storage with rapidly falling costs and maturing supply chains. Long-duration options—flow batteries, thermal storage, iron-air chemistries, hydrogen, and pumped hydro—are moving from pilots to procurement, enabling deeper renewables penetration and seasonal balancing.
- Grid modernization: Advanced inverters, dynamic line ratings, grid-forming batteries, and expanded transmission unlock higher shares of variable renewables while enhancing stability. Digital forecasting and AI-driven operations reduce reserves and curtailment.
- Electrification: Heat pumps and EVs shift fossil end uses to electricity, increasing demand but also offering flexible loads. Managed charging and thermal storage help absorb mid-day solar surpluses and reduce evening peaks.
- Supply chains and manufacturing: Expanded domestic PV and battery manufacturing in the U.S., EU, and India aim to diversify supply, lower embedded emissions, and create local jobs.
- Policy targets: The EU adopted a binding target of at least 42.5% renewables in final energy by 2030 (with an aspiration to 45%). The U.S. Inflation Reduction Act extends clean energy tax credits into the 2030s, with bonuses for domestic content and energy communities. China’s 2030 target of 1,200 GW of wind+solar is on pace to be met ahead of schedule, reshaping global deployment trajectories. India targets 500 GW of non-fossil capacity by 2030. These anchors create visibility for investment and grid planning.
- Cost and performance: Continued declines in PV module and balance-of-system costs, higher module efficiencies (tandems later this decade), and maturing O&M analytics keep driving LCOE lower, even as interconnection and permitting become larger shares of project timelines.
What is renewable energy? It is the rapidly scaling backbone of a decarbonized economy—now cost-competitive, increasingly dispatchable with storage, and central to cleaner air, new jobs, and climate goals. Solar’s modularity and cost lead make it the tip of the spear, complemented by wind’s scale, hydropower’s flexibility, geothermal’s firmness, and storage’s time-shifting power. With smart policy, grid upgrades, and continued innovation, the next decade will translate record additions into durable, resilient, low-cost energy systems.
Recommended Products
Sustainable Energy - without the hot air: MacKay, David JC
Written by David MacKay, who was an esteemed Professor of Engineering at the University of Cambridge and Chief Scientific Advisor to the UK Department of Climate Change, this is <strong>an uplifting,
EF ECOFLOW Solar Generator DELTA 2 with 220W Solar Panel, 1024Wh LFP(LiFePO4) Battery, 1800W AC/100W USB-C Output, Fast Charging Portable Power Station for Home Backup Power, Camping & RVs : Patio, Lawn & Garden
Clean, Green Charging. With up to 500W of solar panel input, DELTA 2 is a solar generator that can be charged while camping, on an RV trip or off-grid. <strong>Includes a 220W Bifacial solar panel to
Emporia Gen 2 Smart Home Energy Monitor with 16 50A Circuit Level Sensors | Real Time Electricity Monitor/Meter | Solar/Net Metering - Amazon.com
See how much electricity your home is using anywhere, anytime. ... <strong>Add individual 50A sensors to your Vue to monitor up to 16 individual circuits</strong> — providing accurate energy use for t