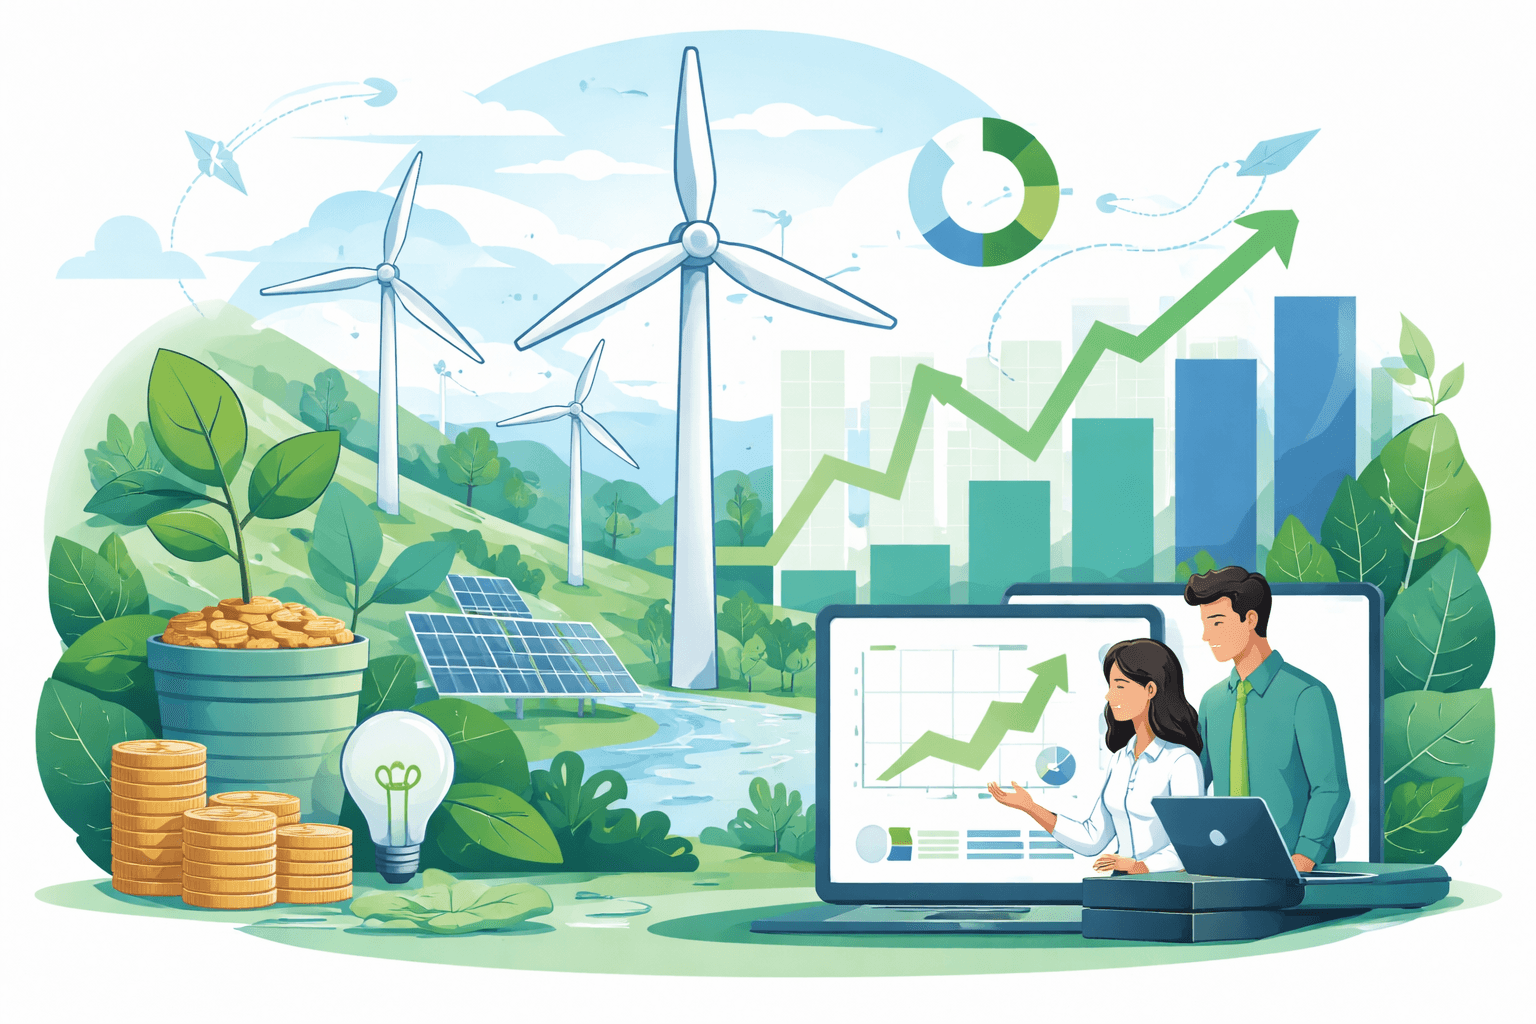
Why Invest in Wind Energy: Financial, Environmental, and Risk Benefits
Wind added a record ~117 GW of new capacity in 2023, pushing global installations past 1 terawatt for the first time, according to the Global Wind Energy Council (GWEC, 2024). At the same time, the unsubsidized levelized cost of energy (LCOE) for onshore wind remains among the cheapest sources of new generation—roughly $27–$73/MWh per Lazard (2024) and 3–6 cents/kWh on a global-weighted basis per IRENA (2023). For investors assessing wind energy investment benefits, those two facts frame a compelling case: large and growing markets, with established cost competitiveness and multiple ways to capture value.
This guide quantifies the core financial benefits and revenue models, explains the ESG and climate value wind provides, dissects the key risks and mitigations, lays out major incentives and financing structures, and highlights technology and market trends shaping long-term returns.
Wind energy investment benefits: financial returns and revenue models

Renewable Energy Finance: Powering The Future: Donovan, Charles W
But now clean energy is the safe bet for investors, as is argued in Renewable Energy Finance: Powering the Future, edited by Dr Charles Donovan, <strong>Principal Teaching Fellow at Imperial College B
Check Price on AmazonCost, performance, and cash flow basics
- Capital costs: Onshore wind projects typically cost about $1.2–$1.8 million per MW to build globally (IEA, 2023), with site-specific variation from interconnection and civil works. Fixed-bottom offshore wind remains higher, generally $3–$6 million per MW, depending on market and supply-chain conditions.
- Operating costs: Onshore operations and maintenance (O&M) often run $10–$20/MWh; offshore O&M typically $30–$60/MWh (IEA/NREL).
- Capacity factor: Modern onshore fleets achieve 30–45% capacity factors; offshore projects commonly reach 45–60% in high-resource sites (IEA/NREL). Capacity factor is the share of time a turbine generates at its rated output, averaged over a year.
- Project life: 25–35 years is typical. Many investors underwrite a 25–30-year life with repowering options after 15–25 years.

Davis Instruments Wireless Vantage Pro2 Weather Station with WeatherLink Console - Metric : Patio, Lawn & Garden
View on AmazonLCOE provides a like-for-like way to compare projects by spreading all costs over expected energy output. Recent analyses place onshore wind’s unsubsidized LCOE at $27–$73/MWh (Lazard, 2024), with IRENA’s global-weighted figure generally in the 3–6 cents/kWh range. Offshore costs remain higher—$72–$140/MWh (Lazard, 2024)—but continue to decline over the long term despite supply-chain headwinds in 2022–2024.
Revenue streams and contract structures
- Power Purchase Agreements (PPAs): Long-term contracts (10–20 years) with utilities or corporates lock in prices and volumes, anchoring project finance. Corporate clean energy procurement reached ~36 GW globally in 2023 (BloombergNEF), with wind a mainstay of deals. Structures include physical PPAs and virtual PPAs (vPPAs), which settle financially against a market hub.
- Merchant sales: Spot or short-term market sales can capture upside in high-price hours but expose investors to price volatility and curtailment risk. Many developers blend merchant tails after long-term PPAs.
- Contracts for Difference (CfDs): Common in the UK and parts of the EU, CfDs stabilize revenue by paying the difference between a fixed strike price and market prices.
- Environmental attributes: Renewable Energy Certificates (RECs, North America) and Guarantees of Origin (GOs, Europe) can add $1–$10/MWh depending on market.
- Capacity and ancillary services: Wind receives limited capacity credit (often 10–30% of nameplate, market dependent) but this can be material in capacity markets. Curtailment management and co-located storage can open additional grid-services revenue.
- Tax credits (U.S.) or investment grants: In the U.S., Production Tax Credits (PTC) add material value for 10 years; the Investment Tax Credit (ITC) can be elected instead—considered below.
Returns, timelines, and key cost drivers
- Timelines: After permits and interconnection, onshore construction is typically 12–18 months. Offshore is 2–4 years, with longer lead times for ports and vessels.
- Returns: Levered internal rates of return (IRR) for contracted onshore wind in mature markets often pencil in the mid-to-high single digits (e.g., 6–10%). Merchant exposure, emerging markets, or repowering may target low double-digit IRRs, with higher volatility. Cash yield can be modest in early years due to amortizing debt, rising later as leverage declines.
- Drivers to underwrite: Turbine pricing and availability, logistics, balance-of-plant costs, interconnection upgrades, curtailment and congestion risks, financing costs (interest rates and spreads), resource assessment uncertainty, and O&M/availability guarantees from OEMs.
Kestrel 5500 Weather Meter with Link and Vane Mount, Olive Drab : Patio, Lawn & Garden
View on AmazonDebt typically covers 60–80% of capex in non-recourse project finance with debt service coverage ratios (DSCR) in the 1.3–1.5x range. Interest-rate hedging, conservative P50/P90 energy production cases, and robust reserve accounts are standard.
By the numbers: wind investment at a glance
- 117 GW: New wind capacity added globally in 2023; global capacity surpassed 1 TW (GWEC, 2024)
- $27–$73/MWh: Unsubsidized onshore wind LCOE (Lazard, 2024)
- 3–6 cents/kWh: IRENA global-weighted onshore wind LCOE (IRENA, 2023)
- 30–45% / 45–60%: Typical onshore/offshore capacity factors (IEA/NREL)
- 1.4 million: Global wind energy jobs (IRENA, 2023)
- ~11 gCO2e/kWh: Wind’s lifecycle emissions vs. ~450–1,000 g for gas/coal (IPCC AR6)
For context on how wind fits among renewable options and portfolios, see Renewable Energy Sources: A Clear Guide to Solar, Wind & More (/renewable-energy/renewable-energy-sources-guide).
Environmental and ESG advantages investors can quantify
Low lifecycle emissions and real-world abatement
- Lifecycle emissions: Median lifecycle emissions for onshore wind are ~11 gCO2e/kWh (IPCC AR6), including materials, manufacturing, and decommissioning. Offshore is similar, typically under 15 gCO2e/kWh.
- Avoided emissions: Emissions reductions depend on the displaced grid mix. In coal-heavy systems, every MWh of wind can avoid 0.8–1.0 tCO2; in gas-dominated systems, 0.3–0.5 tCO2 per MWh (IEA/EPA factors). These abatements are reportable toward Scope 2 (market-based) targets when tied to PPAs or RECs.
Water, land, and biodiversity outcomes
- Water: Wind generation uses essentially no water during operation, avoiding 1–4 liters per kWh relative to thermal power’s cooling needs (EIA/NREL). In arid regions, this is a material co-benefit.
- Land use: Turbines occupy a small permanent footprint, enabling agriculture or grazing between towers. Careful siting and operational curtailment strategies mitigate bird and bat impacts; modern environmental assessments and adaptive management are now standard in permitting.
ESG mandates and corporate value
- Alignment with SBTi/RE100: Corporates increasingly use long-term wind PPAs to meet Science Based Targets initiative commitments and RE100 renewable electricity goals, often prioritizing additionality (new-build projects).
- Disclosure-ready: Wind-backed decarbonization supports reporting under ISSB/IFRS S2, EU CSRD, and U.S. SEC climate proposals. Investors can attribute avoided emissions to financed emissions targets (PCAF) where applicable.
- Reputation and market access: Demonstrable emissions reductions can improve access to sustainability-linked finance, lower cost of capital via green bond frameworks, and enhance brand value.
Risk profile and how to mitigate it
Intermittency, price, and basis risk
- Intermittency: Variable output drives capture price risk—realized prices can be below hub prices in windy hours. Congestion and curtailment can widen the “basis” between node and hub.
- Tools: Long-term PPAs or CfDs stabilize revenue. Financial hedges (bank hedges, proxy revenue swaps) can cover downside from low generation or low prices. Location-specific nodal modeling is essential to price basis risk.
Grid interconnection and integration
- Queue delays: In the U.S., more than 2,600 GW of generation and storage sat in interconnection queues at end-2023, with median timelines approaching 5 years (Lawrence Berkeley National Laboratory, 2024). Similar backlogs exist in parts of Europe and Asia.
- Mitigations: Early interconnection studies, selecting sites with existing transmission capacity, and hybridizing with storage to reduce curtailment. Co-located batteries can shift output to high-price hours and provide grid services. For a deeper dive, see Energy Storage Explained: Types, Costs, and How It Powers the Grid (/ai-technology/energy-storage-explained-types-costs-grid).
Policy, permitting, and offtake risk
- Policy durability: Incentives can change with elections or budgets. Diversifying across jurisdictions, anchoring revenue with multi-year PPAs/CfDs, and conservative underwriting for post-subsidy years reduce exposure.
- Permitting: Environmental reviews, community consent, and wildlife considerations can extend timelines. Proactive engagement and transparent benefit-sharing (e.g., community funds, local jobs) improve social license to operate.
Technology and supply-chain risk
- OEM risk: Turbine reliability and OEM balance-sheet health matter. Availability guarantees (e.g., ≥97%), performance warranties, and long-term service agreements reduce downtime risk.
- Repowering uncertainty: Component availability and grid rules affect repowering economics. Scenario-test repowering vs. life extension.
Insurance and diversification
- Weather and revenue hedges: Parametric weather insurance, proxy revenue swaps, and catastrophe coverage can protect cash flows.
- Portfolio diversification: Blend onshore and offshore, multiple wind regimes, and hybrid wind-solar-storage projects to smooth returns.
Policy, tax, and financing incentives that move the needle
United States: IRA-era credits and flexibilities
- Production Tax Credit (PTC, Sec. 45): For projects meeting prevailing wage and apprenticeship rules, the 2024 PTC is roughly 2.9 cents/kWh (~$29/MWh) for 10 years, inflation-adjusted (IRS). Adders can increase value: up to 10% for domestic content and 10% for energy communities.
- Investment Tax Credit (ITC, Sec. 48): Alternatively, a 30% ITC on eligible basis (with similar adders) is available. Offshore wind often opts for ITC due to higher capex and strong capacity factors.
- Transferability and direct pay: The IRA allows tax-credit transferability (widening the buyer pool) and direct pay for certain entities, improving financing flexibility.
- Transition to tech-neutral credits: Starting in 2025, the 45Y (PTC) and 48E (ITC) credits apply based on emissions performance rather than technology, with statutory availability through at least 2032 or until emissions targets are met.
Effect on returns: A full-value PTC can be equivalent to adding ~$25–$30/MWh of revenue for 10 years; for high-capex projects or offshore, a 30–50% ITC (with adders) can substantially lower upfront equity and lift IRRs.
Europe and other markets
- UK CfD scheme: Provides long-term revenue certainty via inflation-indexed strike prices, lowering cost of capital and enabling deep leverage.
- EU auctions and two-way CfDs: Many member states run indexed premium or CfD auctions; the EU ETS carbon price further supports market prices over time.
- Emerging markets: Incentives range from feed-in tariffs and accelerated depreciation to grid-priority dispatch. Political and currency risks warrant higher return thresholds and hedging.
Financing structures and sustainable capital
- Non-recourse project finance: Common for utility-scale wind; banks and institutional lenders provide long-tenor debt with sculpted amortization.
- Green bonds and sustainability-linked loans: Labelled debt can broaden investor pools and, in some cases, reduce coupon via KPI-linked step-downs.
- Yieldcos and listed infrastructure funds: Offer public-market access to de-risked, contracted wind assets, distributing stable cash flows.
- Tax equity (U.S.): Historically crucial for monetizing credits; transferability now complements or substitutes tax equity in some deals.
Future growth and technology trends that affect returns
Offshore and floating wind
Offshore wind is expanding rapidly, with North Sea projects delivering capacity factors above 50% and multi-gigawatt buildouts in Asia and North America. While supply-chain inflation hit 2022–2024 projects, long-term fundamentals remain strong as ports, vessels, and turbine platforms scale. Floating wind opens deep-water sites; today’s pilot-scale LCOE is high, but IRENA and IEA expect substantial cost declines by 2030–2040 as manufacturing and mooring systems standardize.
For deployment trends and siting dynamics, see Wind Energy Growth: Analyzing the Global Shift to Offshore Wind Farms (/renewable-energy/wind-energy-growth-global-offshore-wind-farms).
Bigger, smarter turbines
- Onshore: 5–7 MW machines with 150–170+ meter rotor diameters are increasingly standard in new markets, lifting annual energy production and improving economics at lower-wind sites.
- Offshore: 15–18 MW turbines reduce installation counts per GW and spread fixed costs over larger machines, aiding LCOE reductions.
- Digital O&M: Condition monitoring, lidar-assisted controls, and predictive analytics raise availability and lower O&M, tightening P50–P90 spreads and improving debt capacity.
Repowering and life extension
Repowering—replacing nacelles and blades or full towers while reusing foundations and interconnects—can boost energy by 25–50% at legacy sites (NREL studies) and reset depreciation schedules. Investors should evaluate repowering options against component life-extension programs based on OEM warranties and site wind classes.
Hybrid projects and storage
Wind-plus-solar-plus-storage projects share interconnection capacity, reduce curtailment, and increase capture prices by shifting output. Storage also unlocks ancillary-service revenues and firm blocks for commercial offtakers. The economics of 1–4 hour batteries are improving as costs fall and market rules evolve to reward flexibility.
Market drivers and demand signals
- Electrification and data centers: Rising electricity demand from EVs, heat pumps, and hyperscale data centers is pushing utilities and corporates to secure long-term clean supply.
- Green hydrogen and industrial loads: Co-locating wind with electrolysis can monetize low-price hours and create new offtake profiles.
- Grid reforms: Queue reform, proactive transmission buildout, and improved congestion management will directly affect realized prices and project risk in the next decade.
Practical implications for investors, corporates, and policymakers
- Investors: Underwrite with conservative price and basis assumptions, stress-test interconnection and curtailment, and evaluate PTC vs. ITC election where applicable. Consider portfolio approaches across geographies, onshore/offshore, and hybrids to stabilize returns.
- Corporates: Long-term wind PPAs remain one of the most cost-effective Scope 2 decarbonization tools. vPPAs can be structured to manage accounting and risk preferences; prioritize additionality and grid impact.
- Policymakers: Stable, transparent auction and incentive frameworks (e.g., multi-year CfDs, well-designed interconnection reform) lower cost of capital and accelerate deployment while maintaining biodiversity safeguards and community benefits.
Bottom line
Wind’s investment case rests on three pillars: cost-competitive energy with multiple bankable revenue structures; quantifiable climate and ESG value; and maturing risk-management tools that address variability, grid constraints, and policy uncertainty. As turbine technology scales, storage integration deepens, and transmission upgrades unlock better capture prices, well-structured wind investments are positioned to deliver resilient, inflation-protected cash flows and durable climate impact over multi-decade horizons.
Recommended Products
Renewable Energy Finance: Powering The Future: Donovan, Charles W
But now clean energy is the safe bet for investors, as is argued in Renewable Energy Finance: Powering the Future, edited by Dr Charles Donovan, <strong>Principal Teaching Fellow at Imperial College B
Kestrel 5500 Weather Meter with Link and Vane Mount, Olive Drab : Patio, Lawn & Garden
Once mounted, the Kestrel 5500 ... – with <strong>a large wind vane and precision pivot keeping the Kestrel oriented into the wind for continuous measurement and logging of wind speed, wind direction,
Davis Instruments Wireless Vantage Pro2 Weather Station with WeatherLink Console - Metric : Patio, Lawn & Garden
Mount anemometer up to 12 m from the rest of sensor suite for flexible siting. Rugged, weather-proof housing gives you years of reliable data. Sensor suite is solar-powered with battery back-up; conso