Why Wind Energy Wins: The Key Environmental, Economic and Grid Advantages
Wind power crossed a symbolic threshold in 2023: global installed capacity topped 1 terawatt after a record 117 GW of new additions (Global Wind Energy Council, 2024). That scale—and the technology’s rapid cost declines—explain why the advantages of wind energy have become central to climate policy, industrial strategy, and grid planning worldwide.
Below, we break down the environmental, economic, security, technology, and system-level benefits, with the data and definitions a motivated reader needs to evaluate wind on its merits.
Environmental advantages of wind energy
Ultra‑low lifecycle carbon emissions
- Lifecycle greenhouse gas (GHG) emissions for onshore wind average ~11–12 gCO2e/kWh, including manufacturing, transport, installation, operations, and decommissioning (IPCC AR6; NREL meta-analyses). For comparison: utility solar PV ~20–40 gCO2e/kWh, combined‑cycle gas ~450 gCO2e/kWh, and coal ~820–1,000 gCO2e/kWh.
- Scale matters: global wind generation produced roughly 2,300 TWh in 2023 (IEA, Electricity 2024). A back‑of‑the‑envelope calculation shows the impact: replacing fossil generation at ~450 gCO2/kWh with wind at ~12 gCO2/kWh avoids on the order of 1 gigaton of CO2 annually. Actual avoided emissions vary by what wind displaces on each grid, but the magnitude is unambiguously large.
Major air‑pollution reductions
Wind turbines generate electricity without combustion, which means near‑zero emissions of sulfur dioxide (SO2), nitrogen oxides (NOx), mercury, and fine particulates during operation. Health‑impact assessments consistently find large public‑health benefits when wind displaces coal and oil generation, including fewer hospitalizations and premature deaths (U.S. EPA and various peer‑reviewed studies). These co‑benefits are often valued in the tens of dollars per MWh in regions with high fossil generation shares.
Minimal water use and climate resilience
Thermal power plants (coal, gas, nuclear) withdraw and consume large quantities of freshwater for cooling. Typical consumption is on the order of:
- Coal: ~300–500 gallons/MWh
- Combined‑cycle gas: ~150–300 gallons/MWh
- Nuclear: ~400–720 gallons/MWh
- Wind: essentially zero for operation (UCS; EPRI; NREL water‑use inventories)
In drought‑prone regions, the water advantage of wind energy reduces competition with agriculture and municipal supply, and lowers thermal derating risks during heatwaves.
Land‑use efficiency and co‑location with agriculture
A common misconception is that wind “uses” vast amounts of land. On modern wind farms, 95–98% of the project footprint remains available for existing land uses—often grazing or crop production—because only the turbine pads, access roads, and substations are fenced (U.S. DOE/NREL). This co‑location reduces habitat fragmentation relative to many other forms of energy development. When sited carefully and with curtailment/abatement strategies (e.g., seasonal operational adjustments, turbine‑specific shutdowns), wind can minimize wildlife impacts while delivering large emissions cuts. For a deeper dive into evidence and trade‑offs, see Wind Energy Facts vs. Myths: Evidence, Trade-offs, and What Really Matters (/sustainability-policy/wind-energy-facts-vs-myths-evidence-trade-offs).
Economic advantages: costs, jobs, and community revenue
Competitive—and falling—levelized costs
Levelized cost of energy (LCOE) is the average cost of generating one megawatt‑hour (MWh) over a project’s lifetime, including capital and operating costs. According to Lazard’s 2024 LCOE analysis, onshore wind’s unsubsidized costs typically range around $27–$73/MWh, making it one of the lowest‑cost sources of new bulk power in many markets. Offshore wind remains higher today (often >$80/MWh) but is expected to decline with supply‑chain scale and standardized turbine platforms.
Two structural advantages drive wind’s competitiveness:
- Zero fuel cost: no exposure to volatile gas or coal prices. Once built, the marginal cost to run is extremely low.
- Technology learning: larger rotors, taller towers, and better controls have improved capacity factors (the share of time a turbine generates at its rated output). U.S. onshore fleet averages ~35–40%, while new projects in strong wind regimes often exceed 40–45%; modern offshore arrays frequently reach 45–60% (EIA; NREL; operator data).
For consumers and large buyers, fixed‑price wind power purchase agreements (PPAs) can hedge fuel‑price volatility for 10–20 years. Lawrence Berkeley National Laboratory (LBNL) reports recent U.S. wind PPAs commonly in the $30–$50/MWh range depending on region and interconnection costs (LBNL, 2023–2024 briefs).
For a broader finance lens on risk, cost drivers, and returns, see Why Invest in Wind Energy: Financial, Environmental, and Risk Benefits (/sustainability-policy/wind-energy-investment-benefits).
Low operating costs and improving reliability
Modern turbines use condition‑based maintenance and advanced sensing (vibration, temperature, oil debris) to predict component wear, reducing unplanned downtime and O&M costs. Digital twins and fleet‑wide analytics also extend component life and optimize yaw/pitch for more energy capture.
Local jobs and supply‑chain growth
- Employment: IRENA’s Renewable Energy and Jobs report (2023) estimates roughly 1.4 million jobs in the global wind sector (onshore and offshore), spanning manufacturing, construction, operations, and services.
- Domestic manufacturing: Policies like the U.S. Inflation Reduction Act and EU Net‑Zero Industry Act are catalyzing nacelle, blade, tower, and offshore foundation factories, shortening logistics and building regional resilience.
Revenue for rural communities
Landowner lease payments and local tax revenues are tangible, recurring benefits. The American Clean Power Association reports U.S. wind projects provide on the order of a few billion dollars annually in combined land leases and state/local taxes, often stabilizing rural tax bases and funding schools, roads, and emergency services (ACP market reports, 2023–2024).
Long‑term price stability
Because wind has no fuel cost, its levelized cost is dominated by upfront capital and financing. That makes prices relatively predictable over decades. In grids with organized markets, increasing wind penetration also exerts a “merit‑order effect” by displacing higher‑marginal‑cost fossil units, lowering wholesale clearing prices during windy periods.
Energy security and resilience
Diversifying the energy mix and reducing fuel imports
Domestic wind resources—abundant across the Great Plains, North Sea, Patagonia, coastal China, and beyond—reduce dependence on imported fuels. During the 2021–2022 global gas price shock, the IEA found that accelerated renewables deployment, along with demand‑side measures, helped Europe avoid tens of bcm of additional gas consumption and mitigated wholesale power prices.
Hedging supply shocks and climate extremes
- Fuel supply risk: Wind is not exposed to pipeline constraints, maritime chokepoints, or commodity embargoes. Weather can curtail output, but geographic diversity and forecasting allow system operators to plan around variability.
- Extreme weather: Properly winterized turbines can perform well in cold snaps. Conversely, wind output often rises during storm fronts that stress grids. While no single technology is fail‑safe, a diversified portfolio with wind reduces correlated outage risks.
Technological maturity and scalability

Wind Energy Explained: Theory, Design and Application: Manwell, James F., McGowan, Jon G., Rogers, Anthony L.
Wind Energy Explained: Theory, Design and Application [Manwell, James F., McGowan, Jon G., Rogers, Anthony L.] on Amazon.com. *FREE* shipping on qualifying offers. Wind Energy Explained: Theory, Desig
Check Price on AmazonBigger rotors, taller towers, smarter controls
Turbine ratings have climbed steadily. Onshore machines commonly range from 4–6 MW today in new projects, with rotor diameters of 150–170 meters and hub heights often 100–130 meters. Larger rotors sweep more area, capturing more energy, especially at lower wind speeds. Advanced controls (individual pitch, wake steering) boost farm‑level output and reduce loads.

Vernier KidWind Mini Wind Turbine with Blade Design - Learn Renewable Energy & Engineering | Ideal for Outdoor Classrooms | Compatible with Vernier Data Technology : Toys & Games
View on AmazonIf you want a plain‑English tour of components and physics, see How Wind Turbines Work: The Science, Components, and Real‑World Impact (/sustainability-policy/how-wind-turbines-work-science-components-impact).
Offshore and floating platforms expand the resource
Offshore wind opens vast, high‑capacity‑factor resource areas near coastal demand centers, cutting transmission losses and relieving onshore siting pressure. Commercial turbines in the 12–15 MW class are now standard, with 16–18 MW prototypes moving into early deployment. Floating foundations unlock deep‑water sites (e.g., U.S. West Coast, Japan, Mediterranean). Industry trackers expect floating wind to scale from pilot arrays today to roughly 10 GW of cumulative capacity globally by 2030 based on announced pipelines (GWEC; IEA). For a policy and market panorama, see Wind Energy Growth: Analyzing the Global Shift to Offshore Wind Farms (/renewable-energy/wind-energy-growth-global-offshore-wind-farms).
Manufacturing scale and repowering
Global supply chains can deliver >100 GW/year of new wind capacity, and expanding nacelle, blade, and tower factories are adding throughput. Repowering—replacing older, smaller turbines with fewer, larger, more efficient machines—can double or triple output at existing sites, often with limited new land disturbance. Because project lead times are measured in months to a few years (permitting and interconnection vary by country), wind can ramp quickly relative to new nuclear or major gas import terminals.
System and grid benefits
Complementarity with solar and storage
In many regions, wind and solar have offsetting production profiles. Wind often blows stronger at night and in winter; solar peaks midday and in summer. Pairing both with batteries or other storage smooths net load, reducing ramping stress on thermal plants and lowering curtailment. “Curtailment” happens when generation exceeds transmission or demand; adding storage, transmission, or flexible demand soaks up surplus wind, increasing system value.
Studies from system operators (e.g., CAISO, ERCOT, PJM, ENTSO‑E) show that diversified renewables portfolios reduce net‑peak demand and the need for expensive peaker plants.
For a data‑driven comparison with solar across climates and load shapes, see Is Wind Energy Better Than Solar? A Data-Driven Comparison (/renewable-energy/is-wind-energy-better-than-solar-comparison).
Ancillary services from modern wind plants
Using power electronics, modern wind plants can provide grid services once thought exclusive to synchronous generators:
- Frequency response: rapid active‑power changes to stabilize frequency.
- Inertia emulation: synthetic inertia through control algorithms to dampen frequency deviations.
- Voltage support: reactive power and voltage regulation.
- Ramp‑rate control: smoothing output changes to be more dispatchable.
“Grid‑forming” inverters—now piloted in wind and hybrid plants—can set and regulate grid voltage and frequency in weak grids, enabling higher shares of inverter‑based resources (NREL; ENTSO‑E technical reports).
Reducing peak price and congestion pressures
By displacing high‑marginal‑cost generators during windy hours, wind lowers wholesale prices and reduces the duration of scarcity pricing. Where transmission is tight, strategically locating new wind relative to load or planned lines can reduce congestion. Co‑located storage or demand response (e.g., electrolyzers, flexible data centers) can monetize windy, low‑price hours, increasing overall system efficiency.
Policies and market design to maximize advantages
- Long‑term contracts: Contracts for difference (CfDs) and fixed‑price PPAs lower financing costs, passing savings to consumers.
- Robust ancillary service markets: Explicit products for fast frequency response, inertia, and voltage support reward wind’s capabilities.
- Streamlined interconnection and transmission: Queue reform and proactive transmission planning unlock high‑quality wind sites.
- Carbon and pollution pricing: Properly valuing health and climate benefits improves wind’s competitiveness in markets still dominated by fossil fuels.
By the numbers: the advantages of wind energy
- 1,002 GW: global installed wind capacity after 2023 additions (GWEC, 2024).
- ~11–12 gCO2e/kWh: lifecycle emissions for onshore wind (IPCC AR6; NREL).
- $27–$73/MWh: typical unsubsidized LCOE range for onshore wind (Lazard, 2024).
- 35–45%: typical capacity factor for new onshore projects in strong resource areas; 45–60% offshore (EIA; operator data).
- ~0 gallons/MWh: operational water consumption for wind, versus hundreds for thermal plants (UCS; EPRI; NREL).
- ~1.4 million: global wind jobs (IRENA, 2023).
- Billions annually: land‑lease and local tax revenue to U.S. rural communities (ACP, 2023–2024).
Practical implications for consumers, businesses, and policymakers
- Utilities and grid operators: Wind is a cost‑competitive bulk energy source that, when paired with storage and flexible demand, can supply firm, low‑carbon capacity and ancillary services. Investment focus: interconnection upgrades, grid‑forming capabilities, and forecasting.
- Corporates: Long‑term wind PPAs can hedge energy costs and provide credible emissions reductions (Scope 2) aligned with science‑based targets.
- Rural communities: Hosting wind projects can diversify farm/ranch income and stabilize local tax bases with minimal disruption to agricultural activity.
- Policymakers: The “stack” of benefits—GHG cuts, air quality, water savings, jobs, and energy security—justifies streamlining siting and transmission, while ensuring wildlife‑smart practices and community engagement.
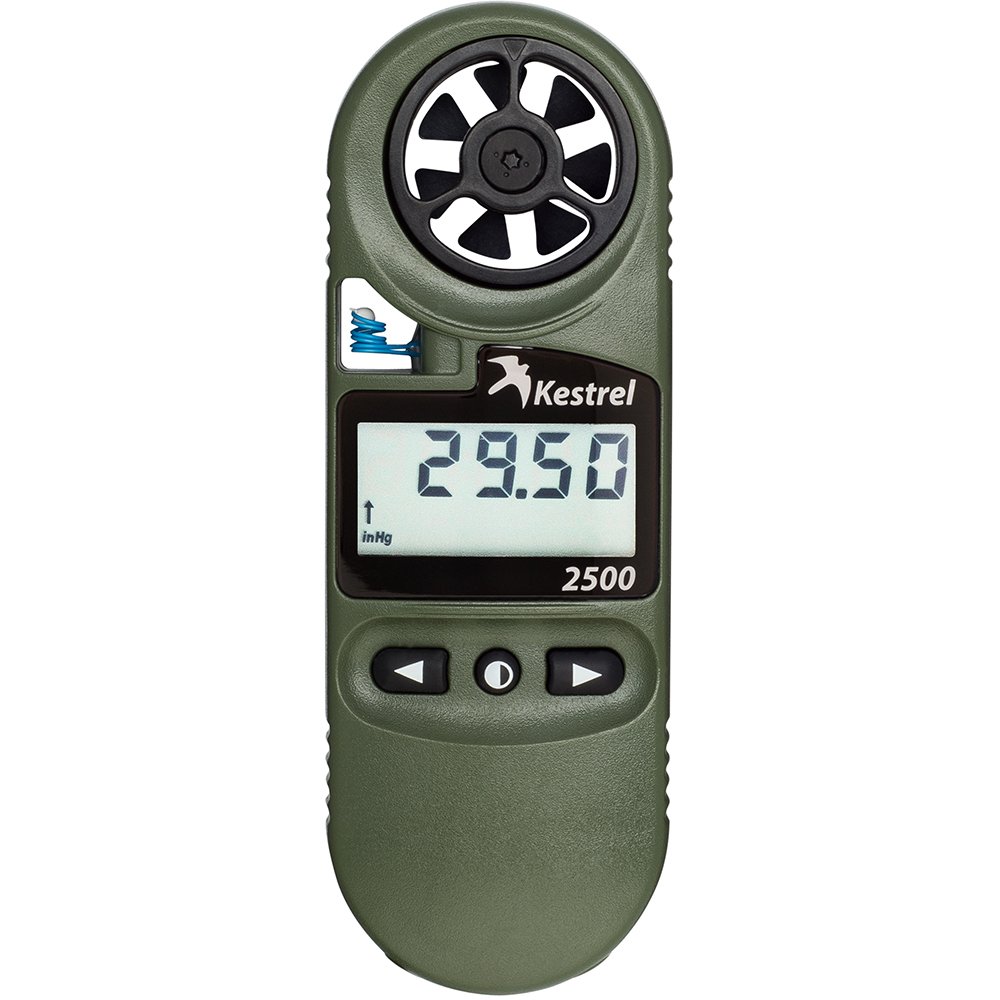
Kestrel 2500 Weather Meter
View on AmazonWhere wind is headed next
Global outlooks from the IEA and IRENA indicate wind must roughly triple in annual additions by 2030 to align with net‑zero pathways. The near‑term challenges—supply‑chain inflation, permitting timelines, interconnection queues—are real but tractable. Standardized turbine platforms, port and vessel build‑outs for offshore, digital O&M, and hybrid wind‑plus‑storage designs are pushing costs down and reliability up. As markets better reward flexibility and resilience, the system value of wind will rise alongside its energy value.
Put simply, the advantages of wind energy are not abstract—they are measurable in avoided emissions, reduced water stress, lower and more stable power prices, high‑quality jobs, and a more secure grid. With smart policy and continued innovation, the next terawatt will arrive faster than the first.
Sources (selected): IPCC AR6; International Energy Agency (Electricity 2024; World Energy Outlook series); International Renewable Energy Agency (Renewable Energy and Jobs 2023); Global Wind Energy Council (Global Wind Report 2024); Lazard Levelized Cost of Energy v17 (2024); Lawrence Berkeley National Laboratory (Wind Technologies Market Reports); U.S. EIA; NREL; American Clean Power Association; UCS; EPRI; ENTSO‑E technical guidance.
Recommended Products
Wind Energy Explained: Theory, Design and Application: Manwell, James F., McGowan, Jon G., Rogers, Anthony L.
Wind Energy Explained: Theory, Design and Application [Manwell, James F., McGowan, Jon G., Rogers, Anthony L.] on Amazon.com. *FREE* shipping on qualifying offers. Wind Energy Explained: Theory, Desig
Kestrel 2500 Weather Meter
With its <strong>easy-to-use digital pressure altimeter, anemometer with replaceable impeller, and external thermistor for the ambient temperature</strong>, the Kestrel 2500 is the perfect instrument
Vernier KidWind Mini Wind Turbine with Blade Design - Learn Renewable Energy & Engineering | Ideal for Outdoor Classrooms | Compatible with Vernier Data Technology : Toys & Games
The KidWind Mini Wind Turbine comes with <strong>an efficiently designed blade set that demonstrates the principles of efficient energy capture</strong>. PORTABLE & COMPACT || Perfect for outdoor