Wind Energy Explained: How It Works, Benefits, Challenges & Future
Wind energy set a new record in 2023, adding roughly 117 gigawatts (GW) of new capacity worldwide and lifting cumulative installations to about 1,020 GW (1.02 terawatts), according to the Global Wind Energy Council (GWEC 2024). Wind now generates an estimated 7.8% of global electricity (Ember, Global Electricity Review 2024) and, in many regions, is among the lowest-cost sources of new power (Lazard LCOE 2024). This is the moment to understand how wind energy works, what it delivers, the trade-offs, and where it’s headed next.
What is wind energy? Key terms and how much it contributes globally
Wind energy is the conversion of the kinetic energy in moving air into electricity. Modern wind turbines use airfoil-shaped blades to capture the wind’s momentum and turn a rotor, which spins a generator. A wind farm aggregates dozens to hundreds of turbines connected to the grid through substations and transmission lines.

Wind Energy Explained: Theory, Design and Application: Manwell, James F., McGowan, Jon G., Rogers, Anthony L.
Wind Energy Explained: Theory, Design and Application [Manwell, James F., McGowan, Jon G., Rogers, Anthony L.] on Amazon.com. *FREE* shipping on qualifying offers. Wind Energy Explained: Theory, Desig
Check Price on AmazonKey terms you’ll see throughout:
- Rated capacity: The maximum output a turbine or wind farm can produce under ideal wind conditions (measured in megawatts, MW, or gigawatts, GW).
- Capacity factor: The ratio of actual energy produced over a period to the energy that would have been produced if operating at rated capacity 100% of the time. It reflects wind resource quality, turbine technology, and operational strategy.
- Fixed-bottom vs. floating: Offshore wind turbines are mounted either on foundations fixed to the seabed (monopile, jacket) or on floating platforms anchored with mooring lines for deeper waters.
- PPA and CfD: Long-term contracts—power purchase agreements (PPAs) and contracts for difference (CfDs)—stabilize revenues for wind projects by locking in prices.
Global contribution and leadership:
- Wind supplied ~7.8% of global electricity in 2023 (Ember 2024). Several countries generated far more: Denmark (~55%), Ireland (~36%), the UK (~28%), Portugal (~28%), and Germany (~27%) regularly see wind as a leading source on their grids (national TSO data; 2023 ranges).
- Cumulative installed capacity reached ~1,020 GW at the end of 2023 (GWEC 2024). China accounted for roughly 60% of new additions in 2023, followed by the U.S., Brazil, Germany, and India. Offshore wind represented ~7–8% of the global total (~75–80 GW cumulative by end-2023; GWEC 2024).
For a deeper primer on turbine physics and components, see our explainer: How Do Wind Turbines Work? Simple Explanation, Components & Facts.
By the numbers: Wind energy in 2023–2024
- 117 GW: New wind capacity added in 2023 (GWEC 2024), the industry’s best year on record.
- ~1,020 GW: Total installed capacity worldwide at end-2023 (GWEC 2024).
- 7.8%: Share of global electricity generated by wind in 2023 (Ember 2024).
- 25–40%: Typical onshore capacity factor; 40–55% for fixed-bottom offshore, with flagship sites exceeding 55% (U.S. EIA; UK BEIS/ESO; project reports).
- $27–$73/MWh: Unsubsidized levelized cost of onshore wind in the U.S. (Lazard LCOE 2024). Offshore: ~$86–$155/MWh amid recent supply chain inflation.
- ~10–12 gCO₂e/kWh: Lifecycle greenhouse gas emissions of wind power (IPCC AR6), among the lowest of any energy source.
- ~1.4 million: Global wind sector jobs (IRENA, Renewable Energy and Jobs 2023), spanning manufacturing, construction, operations, and maintenance.
How wind turbines work: components, capacity factor, and grid integration
Components and the physics of capture
A modern horizontal-axis wind turbine consists of:
- Rotor: Blades and hub. Pitch systems rotate blades to optimize lift and limit loads.
- Nacelle: Gearbox (for most onshore designs), generator, power converter, and control systems.
- Yaw system: Turns the nacelle to face the wind.
- Tower and foundation: Steel tubular towers onshore; monopile/jacket/floating platforms offshore.
As airflow passes the blade, pressure differences create lift, spinning the rotor. The theoretical maximum capture is 59.3% of wind’s kinetic energy (the Betz limit). Real turbines capture a portion of that, trading off efficiency and structural loads. Power scales with the cube of wind speed and the square of rotor diameter, which is why larger rotors at higher hub heights are transformative—winds are typically stronger and steadier aloft.
Capacity factor and performance
Capacity factor (CF) is a practical measure of output quality. New onshore projects in excellent wind regimes can achieve 35–45% CF; typical ranges remain 25–40%. Offshore benefits from smoother, stronger winds and fewer terrain effects: fixed-bottom projects in the North Sea often post 45–55% CF, with exemplars above 55% (UK National Grid ESO; project disclosures). CFs vary by site, turbine model, wake effects within the farm, and curtailment policies.
Grid integration and system services
Wind’s variability is real but manageable with modern grid operations:
- Forecasting: Day-ahead and intra-day forecasts inform dispatch. Numerical weather prediction plus machine learning has cut forecast errors by 10–30% in industry pilots (NREL; utility case studies), reducing reserve needs.
- Geographic diversity: Spreading turbines across regions smooths variability—lulls in one area are offset by wind elsewhere (IEA).
- Power electronics: Converter-based turbines can provide synthetic inertia, frequency response, and reactive power support. Grid-forming inverters are increasingly specified in new plants to enhance stability (NREL 2023).
- Curtailment and congestion: Transmission upgrades and flexible demand limit curtailment. China, for example, reduced wind curtailment from double-digit percentages in the mid-2010s to low single digits by 2022 through ultra-high-voltage lines and market reforms (China NEA).
For a deeper dive on system benefits and trade-offs, see Why Wind Energy Wins: The Key Environmental, Economic and Grid Advantages and Wind Energy Facts vs. Myths: Evidence, Trade-offs, and What Really Matters.
Types of wind power: onshore, offshore, distributed and emerging concepts
Onshore wind (land-based)
- Scale and maturity: Represents over 90% of global wind capacity. Typical modern turbines: 3–6 MW, 120–170 m rotor diameters, 80–120 m hub heights.
- Siting: Ridges, plains, and coastal uplands. Co-use with agriculture and grazing is common—physical infrastructure occupies roughly 1–2% of the land area of a wind farm (NREL), leaving the rest for farming or habitat.
Offshore wind (fixed-bottom)
- Resource quality: Higher, steadier winds, reduced turbulence. Large arrays of 8–15 MW turbines with 200–240 m rotor diameters.
- Foundations: Monopiles dominate in waters up to ~40–50 m deep; jackets/tripods extend to ~60 m depending on seabed and wave climate.
- Markets: North Sea (UK, Germany, Netherlands, Denmark), China’s coastal provinces, and emerging U.S. Atlantic projects. Policy tools like CfDs and long-term offtakes are standard.
Floating offshore wind
- Deep-water solution: Floating platforms (spar, semisubmersible, tension-leg) unlock wind resources in >60 m depths—California, the Mediterranean, Japan, South Korea, Scotland, Norway.
- Status: Still early-stage with ~0.2–0.3 GW installed globally by 2023, but multi-gigawatt pipelines are forming. Demonstrators like Hywind Scotland have reported capacity factors around the mid-50% range (Equinor project data).
Learn more about where, how, and why offshore is scaling in our feature: Wind Energy Growth: Analyzing the Global Shift to Offshore Wind Farms.
Distributed and small wind
- Behind-the-meter turbines for farms, businesses, and campuses can offset retail electricity, but economics depend heavily on wind speeds (>6–7 m/s at hub height), tower height, and interconnection policies. Operations and maintenance (O&M) discipline is critical.
- Community wind: Municipals or cooperatives own medium-scale projects to keep value local.
- Hybrids: Co-locating wind with solar and batteries shares grid interconnections, cuts variability, and boosts capacity factors of the combined site.

Davis Instruments Wireless Vantage Pro2 Weather Station with WeatherLink Console - Metric : Patio, Lawn & Garden
View on Amazon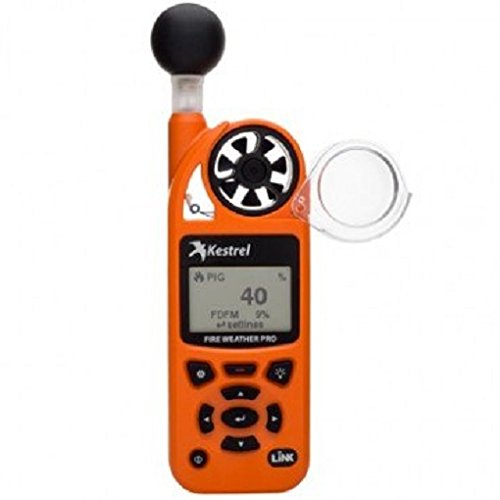
Kestrel 5500 Weather Meter with Link and Vane Mount, Olive Drab : Patio, Lawn & Garden
View on AmazonInterested in residential-scale options and realities? See our guides: Small Wind Turbine Guide for Homes: Cost, Size & Best Models and the updated Home Wind Turbine Buying Guide: Cost, Sizing & Best Models (2026).
Environmental, economic, and social benefits
Emissions and air quality
- Lifecycle climate impact: Wind’s lifecycle emissions are ~10–12 gCO₂e/kWh (IPCC AR6), encompassing raw materials, manufacturing, installation, and end-of-life. That’s roughly 1–2% of unabated coal (~900–1,000 gCO₂e/kWh) and a fraction of combined-cycle gas (~400–500 gCO₂e/kWh without CCS).
- No combustion: Turbines emit no NOₓ, SO₂, or particulate matter in operation, improving air quality and public health compared to fossil generation.
- Water savings: Unlike thermal power plants, wind requires minimal water for operation, easing stress in arid regions (IEA/World Bank).
Costs and competitiveness
- Falling LCOE: Onshore wind remains among the cheapest new sources on many grids, at an unsubsidized $27–$73/MWh in the U.S. (Lazard 2024). Despite recent inflation in steel, logistics, and financing, wind is typically competitive with new gas and cheaper than existing coal in several markets (BNEF; RMI analyses).
- Price stability: Wind has zero fuel cost, insulating consumers from gas and coal price spikes. Long-term PPAs reduce wholesale volatility.
Jobs, revenue, and rural development
- Employment: Around 1.4 million jobs globally (IRENA 2023) in manufacturing, construction, operations, and services. Local content policies and port upgrades amplify job creation in offshore hubs.
- Landowner and community revenue: U.S. land leases and community benefit payments often range from several thousand dollars per MW per year, alongside property tax contributions to schools and services (ACP/AWEA; state agency reports).
- Energy security: Domestic wind capacity reduces reliance on imported fuels and enhances resilience.
Challenges and impacts: intermittency, wildlife, materials, supply chains
Variability and resource complementarity
- Intermittency: Wind output varies hourly, daily, and seasonally. System operators balance this with forecasting, flexible gas/hydro, storage, and demand response. Geographic diversity and wind–solar complementarity reduce net variability—solar peaks midday; wind often strengthens at night or seasonally in winter in many temperate regions (IEA, NREL).
- Capacity credit: In planning, wind’s contribution to peak demand is lower than its average output. Regional studies show onshore wind capacity credit commonly in the 10–35% range depending on coincidence with peak (U.S. ISO/TSO data).
Wildlife and habitats
- Birds and bats: Collision risk exists and is site-specific. Peer-reviewed studies find average bird fatalities at many projects are lower than common anthropogenic sources like buildings or cats, but cumulative impacts matter, particularly for sensitive raptors and migratory bats. Technology and operations help: “smart curtailment” that raises cut-in wind speeds during high-activity periods can reduce bat mortality by 50–70% with modest energy loss (NREL; AWWI/RENCI studies). Siting away from key flyways and nesting areas is the first line of mitigation.
- Offshore ecology: Construction noise (pile driving) and vessel traffic require measures to protect marine mammals. Careful timing, bubble curtains, and alternative foundations help. Long-term, turbine foundations can act as artificial reefs, with complex ecological effects still under study (peer-reviewed marine ecology literature).
- Land and visuals: Setbacks, careful layout, and community benefit schemes address noise, shadow flicker, and landscape concerns. Modern turbines typically produce around 35–45 dB at 300–400 m—comparable to a quiet library—though perceptions vary (WHO environmental noise guidelines; manufacturer data).
Materials, recycling, and critical minerals
- Steel, concrete, copper, and fiberglass dominate wind’s material footprint. Some turbines use permanent-magnet generators with rare earths (neodymium, dysprosium), raising supply and sustainability questions. Many models use geared drivetrains or ferrite magnets to reduce rare earth dependence (IEA Critical Minerals 2023).
- Blade end-of-life: Conventional epoxy blades are challenging to recycle, but progress is rapid. Siemens Gamesa’s RecyclableBlade has been installed at commercial offshore farms; Vestas announced a chemical recycling process to recover high-quality fibers; thermoplastic resins (e.g., Arkema’s Elium) enable melt-and-reform. EU and U.S. decommissioning rules increasingly require end-of-life plans, and cement co-processing of ground blades is a near-term pathway (industry releases; academic LCA studies).
Supply chains and cost volatility
- 2021–2023 headwinds: Steel, resin, freight, and financing costs rose, compressing OEM margins and delaying projects. Some offshore tenders were rebid at higher strike prices. By late 2024, signs of stabilization emerged, and larger turbines plus standardized designs are lowering delivered costs again (Lazard 2024; BNEF 2024; OEM earnings reports).
- Infrastructure: U.S. offshore build-out depends on Jones Act-compliant installation vessels, upgraded ports, and HVDC transmission; Europe is scaling monopile factories and interconnectors to meet 2030 targets.
Technology and innovation: larger turbines, floating wind, storage, AI forecasting
Bigger, better, higher
- Turbine growth: Onshore hub heights are extending beyond 120 m to access stronger winds; rotors have stretched past 170 m. Offshore prototypes in the 18–20 MW class are on test beds, with 13–15 MW in serial production—bigger rotors capture more energy per foundation and cut balance-of-plant costs (OEM specifications; project data).
- Digital twins and advanced controls: Blade pitch optimization, wake steering (slightly yawing upstream turbines), and lidar-assisted control can add 1–5% annual energy without new hardware (NREL field trials; peer-reviewed control studies).
Floating wind to open deep-water basins
- Platform innovation: Semisubmersibles and spars are being simplified for mass manufacturing; shared moorings and dynamic cabling are maturing. Serial production plus standardized anchors can drive cost down the experience curve, echoing fixed-bottom’s trajectory.
Storage and sector coupling
- Batteries: Co-located battery storage smooths ramp rates, captures price spreads, and provides ancillary services. The U.S. alone added double-digit gigawatts of grid batteries in 2023–2024, much of it paired with renewables (U.S. EIA). Even 1–4 hours of storage can increase the market value of wind energy in congestion-prone regions.
- Power-to-X: Excess wind can produce green hydrogen for industry, transport fuels, or seasonal storage. Early projects in the North Sea and U.S. heartland are testing wind-to-hydrogen value chains (IEA Hydrogen 2023).
AI and weather intelligence
- Forecasting gains: Machine learning layered on high-resolution weather models typically reduces day-ahead errors by 10–20% and improves 1–6 hour forecasts even more—boosting revenues by enabling better bids and reducing reserve costs (NREL; utility and platform case studies, 2020–2024).
- Dispatch and maintenance: Predictive O&M using vibration and SCADA data can cut unplanned downtime by 10–30% and extend component life (DNV; OEM analytics reports).
Policy, costs, and how communities and businesses can adopt or support wind
Policy frameworks shaping wind’s trajectory
- United States: The Inflation Reduction Act (IRA) extends and broadens production and investment tax credits, adds bonuses for domestic content and energy communities, and shifts to technology-neutral credits after 2024. Federal offshore leasing (BOEM) continues in the Atlantic and Pacific, with state-level offtake policies (e.g., New York, New Jersey, Massachusetts) anchoring demand.
- European Union and UK: REPowerEU accelerates permitting, grid upgrades, and supply security. The UK’s Contracts for Difference set strike prices; adjustments in 2023–2024 aimed to reflect cost inflation and bring offshore bids back.
- China and India: China remains the largest installer, increasingly focusing on provinces with robust transmission. India is expanding onshore and launching offshore zones with viability gap funding.
- Permitting and transmission: Across markets, faster permitting, wildlife-safe siting, and proactive transmission planning are critical to cut project lead times from 7–10 years toward 3–5 (IEA 2023).
Costs, financing, and market design
- Competitive auctions: Most new utility-scale wind is procured via auctions or bilateral PPAs, which transfer some risk to developers but drive efficiency. Indexation for input costs and inflation-aware bid structures are now common.
- Merchant exposure and hybrids: In high-renewables markets, adding storage or co-locating with solar can raise capture prices and reduce curtailment risk.
- Grid services revenue: As inverter-based resources take a larger grid share, ancillary services markets that pay for inertia, fast frequency response, and voltage support will increasingly reward wind plants with grid-forming capability.
Practical pathways for communities, businesses, and households
- Aggregated procurement: Businesses can band together for virtual PPAs, reaching scale and improving credit terms. Hedging against volatile gas prices often justifies deals on risk-adjusted cost alone.
- Green tariffs and community choice: Utilities and community choice aggregators offer renewable-backed tariffs that expand wind demand without on-site projects.
- Host or co-own projects: Landowners and municipalities can earn lease and tax revenues; community benefit funds support local priorities from habitat restoration to workforce training.
- Support enabling infrastructure: Transmission lines, advanced metering, and flexible demand programs are public goods that unlock low-cost wind.
- Households: If your site is windy and zoning allows, small wind may pencil out—especially with tall towers and clear exposure. For most homes, the better first steps are efficiency, rooftop solar where feasible, and enrolling in 100% renewable electricity plans. For those set on wind, start with our practical references above.
For more context on technology fundamentals and trade-offs, see How Wind Power Works: The Science, Technology, and Real‑World Tradeoffs.
Where wind energy is heading next
- Scaling to 2030: GWEC projects cumulative wind capacity to more than double from 2023 levels by decade’s end under current policies, though the IEA’s Net Zero pathway requires annual additions to roughly triple versus 2023 levels by the early 2030s. That means faster permitting, more transmission, and resilient supply chains.
- Offshore acceleration: Europe, China, and the U.S. are building multi-gigawatt offshore zones, with floating wind unlocking deep waters off California, Japan, and the Mediterranean. As 15–20 MW turbines become commonplace, balance-of-plant costs should fall.
- Smarter, steadier output: Hybrid wind–solar–storage plants, AI-driven operations, and grid-forming converters will make wind behave more like a firm resource, increasing its market value.
- Materials circularity: Recyclable blades, low-carbon steel, and rare-earth-light drivetrains will continue reducing lifecycle emissions and supply risks.
Wind energy has moved from a niche technology to a cornerstone of decarbonized power systems. The next chapter is not just about building more turbines—it’s about building smarter projects, modern grids, and durable community partnerships that deliver reliable, affordable, wildlife-conscious clean electricity at scale.
Recommended Products
Wind Energy Explained: Theory, Design and Application: Manwell, James F., McGowan, Jon G., Rogers, Anthony L.
Wind Energy Explained: Theory, Design and Application [Manwell, James F., McGowan, Jon G., Rogers, Anthony L.] on Amazon.com. *FREE* shipping on qualifying offers. Wind Energy Explained: Theory, Desig
Kestrel 5500 Weather Meter with Link and Vane Mount, Olive Drab : Patio, Lawn & Garden
Once mounted, the Kestrel 5500 ... – with <strong>a large wind vane and precision pivot keeping the Kestrel oriented into the wind for continuous measurement and logging of wind speed, wind direction,
Davis Instruments Wireless Vantage Pro2 Weather Station with WeatherLink Console - Metric : Patio, Lawn & Garden
Mount anemometer up to 12 m from the rest of sensor suite for flexible siting. Rugged, weather-proof housing gives you years of reliable data. Sensor suite is solar-powered with battery back-up; conso