How Wind Power Works: The Science, Technology, and Real‑World Tradeoffs
Wind passed the 1 terawatt mark of installed capacity in 2023 after a record 116 GW was added in a single year, according to GWEC’s Global Wind Report 2024. Understanding how wind power works—physically, mechanically, and on the grid—explains why it’s become one of the fastest-growing sources of zero-carbon electricity and what limits remain.
The physics: where the energy comes from
At its core, wind energy is the kinetic energy of moving air. A wind turbine converts a portion of that kinetic energy into mechanical rotation and then into electricity.

Wind Energy Explained: Theory, Design and Application: Manwell, James F., McGowan, Jon G., Rogers, Anthony L.
Wind Energy Explained: Theory, Design and Application [Manwell, James F., McGowan, Jon G., Rogers, Anthony L.] on Amazon.com. *FREE* shipping on qualifying offers. Wind Energy Explained: Theory, Desig
Check Price on AmazonPower in the wind: the cube law
- Power available in wind is given by P = 0.5 × ρ × A × v³
- ρ is air density (~1.225 kg/m³ at sea level)
- A is the swept area of the rotor (πR²)
- v is wind speed
- The cube relationship is why small increases in wind speed matter so much. For a 1 m² area at 7 m/s, available power is ~210 W; at 9 m/s it’s ~450 W; at 12 m/s it’s ~1,060 W (assuming sea-level density). Real turbines scale that by their swept area, which rises with the square of rotor radius.
The Betz limit: why we can’t take it all
A turbine can’t extract all the kinetic energy or the air would stop dead behind the rotor, blocking flow. The Betz limit shows that the maximum fraction of wind power any rotor can capture is 59.3%. Modern three‑bladed horizontal‑axis turbines peak at a power coefficient (Cp) of ~0.45–0.5 in ideal conditions. Real‑world averages are lower due to changing wind speeds, turbulence, wakes, and control strategies.
Lift beats drag: how blades make torque
Wind turbine blades are airfoils. At the right angle of attack, they generate lift perpendicular to the wind direction. Because blades are mounted on a hub, that lift resolves into torque that turns the rotor.
- Tip‑speed ratio (TSR): the ratio of blade tip speed to wind speed. Modern three‑bladed turbines operate at TSR ~6–9 to maximize Cp while controlling noise and loads.
- Blade pitch: blades twist along their length so each section sees an optimal angle of attack as local relative wind shifts with radius. Pitch actuators continuously trim blade angle to regulate power and protect the turbine in high winds.
How wind power works: from moving air to AC power
A utility‑scale wind turbine is an energy conversion chain. Each component adds control or transformation—and a bit of loss—on the way to grid‑quality electricity. For a component-by-component visual primer, see How Do Wind Turbines Work? Simple Explanation, Components & Facts.
Rotor, hub, and yaw system
- Rotor and blades: typically 2–3 composite blades (glass fiber/epoxy; carbon fiber in spar caps for stiffness). Diameters onshore are commonly 120–170 m; offshore 170–240 m.
- Hub: connects blades via pitch bearings to the low‑speed shaft.
- Yaw system: rotates the nacelle to face the wind using wind direction sensors and motors, minimizing yaw misalignment losses (~1–3% if unmanaged).
Nacelle: drivetrain and generator
Two main architectures dominate:
- Geared (with doubly‑fed induction generator, DFIG): A gearbox steps rotor speed (10–15 rpm) up to thousands of rpm for a compact generator. DFIGs use partial‑scale converters (~30% of power) and are widely used for cost and weight efficiency.
- Direct‑drive (with permanent‑magnet synchronous generator, PMSG): No gearbox; a large‑diameter, low‑speed generator coupled to full‑scale power electronics. Advantages include fewer moving parts and potentially lower maintenance; trade‑offs include higher mass and reliance on rare‑earth magnets (supply chains are diversifying and improving magnet recycling).
Drivetrain losses: bearings, seals, and gearbox mechanical losses typically sum to ~1–3% for geared designs; direct‑drive avoids gearbox losses but still has bearing and windage losses. Generator electrical losses add another ~1–2%.
Controls and protection
- Pitch control sheds aerodynamic load and regulates power above rated wind speed.
- Torque control manages rotor speed below rated to maximize Cp.
- Condition monitoring (vibration, temperature, oil quality) enables predictive maintenance.
- Cut‑in wind speed: ~3–4 m/s; rated power reached near ~11–13 m/s; cut‑out typically ~25 m/s for safety.
Tower and foundations
- Towers: tubular steel (increasingly hybrid steel‑concrete or segmental to reach 120–160 m hub heights onshore). Taller towers access higher, steadier winds.
- Foundations: onshore use spread footings or piles; offshore use monopiles (dominant in shallow waters), jackets (deeper), or floating platforms (spar, semi‑submersible, tension‑leg) for >60–70 m water depths.
Power electronics, transformer, and grid connection
- Full‑scale converters or DFIG converters condition variable‑frequency generator output to grid‑synchronous AC.
- Transformer steps turbine voltage up (e.g., from ~690 V to 20–66 kV for collection systems).
- Substation aggregates turbine strings and steps to transmission voltage (110–400 kV+). Offshore wind uses array cables to an offshore substation; HVAC or HVDC export cables deliver to shore.
- Converter and transformer efficiencies are typically 97–99% each; internal auxiliary loads (heating, cooling, pitch, yaw) consume ~1–2% on average.
Putting it all together, a well‑sited modern turbine converts roughly 35–45% of the instantaneous power passing its rotor into electrical output at rated conditions. Over a year, availability (often 97–99%), curtailment, wakes, and wind variability determine the capacity factor—the ratio of actual generation to the energy that would be produced if the turbine ran at full power all the time.
Types, scales, and siting: why output varies
Understanding how wind power works in practice means understanding turbine configurations, sizes, and the wind resource itself.
Onshore vs. offshore
- Onshore: Lower capex per MW, easier logistics, shorter construction times. Typical capacity factors: 25–45% depending on site; in good U.S. sites, projects built in recent years achieve medians around the mid‑30s% (U.S. DOE Wind Technologies Market Report 2023).
- Offshore: Stronger, steadier winds and no terrain obstacles yield higher capacity factors, commonly 40–55% with leading North Sea projects often around 50%. Costs are higher due to marine foundations, installation, and maintenance, but learning rates remain strong (IEA, GWEC 2024). Commercial turbines of 12–15 MW are common; 16 MW models are operating in China, with larger machines announced for the mid‑2020s (GWEC 2024).
For a deeper dive on global buildout patterns and economics offshore, see Wind Energy Growth: Analyzing the Global Shift to Offshore Wind Farms.
Horizontal‑axis vs. vertical‑axis
- Horizontal‑axis wind turbines (HAWTs) dominate utility‑scale markets thanks to high efficiency at relevant TSRs and mature supply chains.
- Vertical‑axis wind turbines (VAWTs) can have benefits in turbulence or for niche applications but generally show lower Cp. Research continues on VAWT arrays and urban micro‑siting, though most distributed systems still use small HAWTs.
Utility‑scale vs. distributed
- Utility‑scale onshore: 3–6 MW per turbine, 120–170 m rotors, hub heights 90–140 m.
- Offshore: 12–15 MW per turbine today, 170–240 m rotors, hub heights 100–150 m.
- Distributed/small wind: tens of watts to ~100 kW for farms, businesses, or remote sites; output and economics are highly site‑specific and sensitive to tower height and turbulence.
Wind resource assessment and siting
- Measurement: meteorological masts and remote sensing (LiDAR, SoDAR) build multi‑year wind profiles. Engineers use Weibull distributions to model frequency of wind speeds and shear profiles to estimate how wind increases with height.
- Power density: a site’s average v³ (not just average v) drives energy yield. Smooth, unobstructed terrain and offshore environments reduce turbulence and losses.
- Wake effects: turbines create downstream velocity deficits and added turbulence. Wind farm layouts space turbines 3–5 rotor diameters crosswind and 6–10 downwind to balance land use and wake losses. Plant‑level losses from wakes can be 5–15% without optimization; modern wake steering can reduce these.
- Grid proximity and permitting: interconnection capacity, wildlife considerations, sound regulations, visual impacts, and community input shape viable locations and timelines.
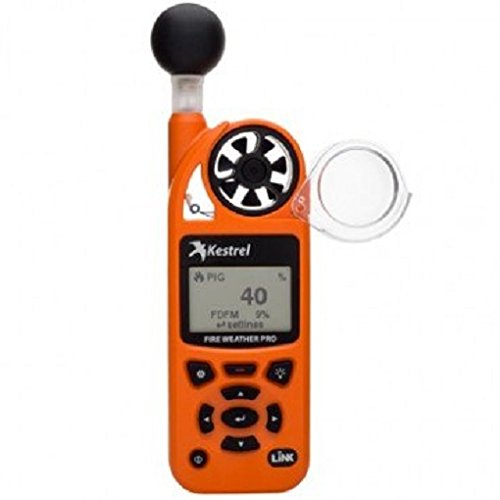
Kestrel 5500 Weather Meter with Link and Vane Mount, Olive Drab : Patio, Lawn & Garden
View on Amazon
Davis Instruments Wireless Vantage Pro2 Weather Station with WeatherLink Console - Metric : Patio, Lawn & Garden
View on AmazonBy the numbers
- 1+ TW: Global cumulative wind capacity in 2023; 116 GW added in 2023 (GWEC 2024)
- 7–8%: Wind’s share of global electricity in 2023 (IEA Electricity Market Report 2024)
- 50–60%: Typical peak rotor efficiency (Cp) for modern turbines is ~0.45–0.5 vs. the 59.3% Betz limit
- 210/450/1,060 W/m²: Power density at 7/9/12 m/s at sea-level air density
- 25–45%: Onshore capacity factor range; 40–55% offshore, with leading sites ~50%
- $27–$73/MWh: Onshore wind LCOE, unsubsidized (Lazard LCOE v17, 2024)
- $72–$140+/MWh: Offshore wind LCOE, regionally variable (Lazard LCOE v17, 2024)
- ~11–12 g CO₂e/kWh: Lifecycle emissions intensity (IPCC AR6 medians)
- 6–12 months: Typical onshore energy payback time; ~1–2 years offshore (NREL, IEA literature reviews)
Benefits, constraints, and the road ahead
Wind’s rapid growth reflects a compelling mix of environmental, economic, and system-level attributes—alongside real constraints that grid planners must manage.
Environmental profile
- Very low lifecycle emissions: Manufacturing, transport, and installation dominate embodied carbon; operations emit none. At ~11–12 g CO₂e/kWh (IPCC AR6), wind is comparable to nuclear and lower than utility‑scale solar PV medians.
- Land and wildlife: The physical footprint of foundations and access roads is modest relative to leased area; co‑use with agriculture is common onshore. Bird and bat collisions are real but site‑ and species‑specific. Targeted siting, turbine curtailment during low‑wind migration windows, smart lighting, and acoustic deterrents reduce impacts, with studies showing material declines in fatalities when such measures are applied (U.S. DOE/NREL, peer‑reviewed mitigation studies).
- Materials and recycling: Towers and nacelles are largely recyclable. Legacy thermoset blades are harder to recycle, but solutions are scaling: cement co‑processing, mechanical/chemical recycling, and new thermoplastic or recyclable epoxy systems entering the market.
- Water savings: Wind uses negligible water in operation, displacing thermal generation that withdraws/consumes significant volumes (IEA, USGS).
Variability and grid integration
Wind is variable but increasingly predictable. Modern power systems use a portfolio of tools to integrate high shares reliably.
- Forecasting: High‑resolution numerical weather prediction and machine‑learning now inform unit commitment hours to days ahead, reducing reserve requirements.
- Geographic diversity: Dispersed wind plants smooth aggregate output; transmission enables balancing across regions.
- Flexible resources: Hydro, gas peakers, and demand response provide ramping and reserves. Storage can shift wind from off‑peak to peak hours. See our explainer on options in Energy Storage Explained: Types, Costs, and How It Powers the Grid.
- Curtailment: In very windy hours with limited transmission, some output is curtailed; grid reinforcements, storage, and advanced controls reduce curtailment over time.
- System studies and real‑world operations show countries reliably running power systems with 30–60% annual wind shares (e.g., Denmark >50% in 2023; Ireland and Portugal ~30–40%), using these techniques and market designs (TSOs/national statistics).
Economics: costs, learning, and risk
- LCOE: Onshore wind’s unsubsidized LCOE of ~$27–$73/MWh (Lazard 2024) puts it among the cheapest new grid‑scale options in many regions. Offshore costs are higher and more volatile but have fallen over the long run; supply‑chain inflation in 2022–2023 caused short‑term setbacks, with contracts and designs now adjusting.
- Capacity factor gains: Larger rotors on similar generator ratings (“rotor‑over‑rating”) increase annual energy capture at moderate winds, improving project economics by boosting capacity factor without proportionally increasing drivetrain costs.
- Jobs and local value: Construction and O&M create local employment; leasing and tax revenues support municipalities and landowners (IEA, national energy agencies).
- Risk management: Merchant price volatility and interconnection queues are key developer risks today; multi‑technology hybrids (wind+solar+storage) and long‑term offtake contracts mitigate exposure.
Common misconceptions (and what the data say)
- “Wind turbines consume more energy to build than they produce.” False. Multiple lifecycle assessments show energy payback times of months, not decades (NREL, IEA).
- “Wind can’t support reliable grids.” Experience in high‑wind regions shows reliability is maintained with forecasting, flexibility, and market reforms. System adequacy depends on portfolios, not any single source.
- “Bird deaths from wind exceed other sources.” Also false when contextualized: buildings, vehicles, and cats cause orders of magnitude more avian mortality. That said, site‑specific wind impacts must be minimized with proven mitigation.
For a deeper, evidence‑based look at claims like these, see Wind Energy Facts vs. Myths: Evidence, Trade-offs, and What Really Matters.
Emerging technologies to watch
- Larger rotors and taller towers: Rotor diameters >170 m onshore and >230 m offshore capture more energy at lower winds, raising capacity factors. Hub heights of 140–160 m onshore unlock new regions with moderate surface winds.
- Floating offshore wind: Spar, semi‑submersible, and tension‑leg platforms open deep‑water wind where ~80% of global offshore wind resource resides (IEA). Industrialization is now focused on mooring systems, dynamic cables, and serial production to cut costs.
- Advanced controls: Lidar‑assisted feed‑forward control, individual pitch control, and wake steering can boost farm energy by a few percent and reduce loads—small gains with large dollar impacts across a fleet.
- Power electronics and grid services: Grid‑forming inverters, synthetic inertia, and fast frequency response enable wind to contribute stability as synchronous generation retires.
- Materials and manufacturing: Recyclable blades, low‑carbon steel, and optimized logistics (rail/road modular towers, on‑site blade fabrication) cut emissions and costs; magnet thrifting and recycling ease rare‑earth constraints.
- Hybridization and hydrogen: Co‑locating wind with solar smooths output profiles and shares infrastructure. Surplus wind can drive electrolyzers for green hydrogen in regions with strong wind seasons.
Practical implications
- Consumers: Where wind penetrations are high, wholesale prices tend to drop in windy hours, lowering average power costs. Some regions see time‑of‑use rates that reward flexibility.
- Businesses: Corporate PPAs with wind can hedge long‑term power prices and cut Scope 2 emissions. Siting near transmission and balancing resources reduces curtailment risk.
- Policymakers and planners: Fast interconnection queues, transmission build‑out, and stable auction frameworks are now primary bottlenecks. Standards for recyclable materials and wildlife mitigation can align scale‑up with conservation goals.
Where wind is heading
IEA projects wind generation to roughly triple by 2030 under announced policies, with faster growth in net‑zero pathways. The core physics that govern how wind power works—v³ scaling, Betz‑limited capture, and airfoil efficiency—haven’t changed. What is changing are the levers engineers can pull: bigger rotors, smarter controls, deeper waters via floating platforms, and grids designed around variable renewables. As these advances compound, wind’s role expands from a low‑carbon option to a cornerstone of reliable, affordable, and clean power systems worldwide.
Recommended Products
Wind Energy Explained: Theory, Design and Application: Manwell, James F., McGowan, Jon G., Rogers, Anthony L.
Wind Energy Explained: Theory, Design and Application [Manwell, James F., McGowan, Jon G., Rogers, Anthony L.] on Amazon.com. *FREE* shipping on qualifying offers. Wind Energy Explained: Theory, Desig
Davis Instruments Wireless Vantage Pro2 Weather Station with WeatherLink Console - Metric : Patio, Lawn & Garden
Mount anemometer up to 12 m from the rest of sensor suite for flexible siting. Rugged, weather-proof housing gives you years of reliable data. Sensor suite is solar-powered with battery back-up; conso
Kestrel 5500 Weather Meter with Link and Vane Mount, Olive Drab : Patio, Lawn & Garden
Once mounted, the Kestrel 5500 ... – with <strong>a large wind vane and precision pivot keeping the Kestrel oriented into the wind for continuous measurement and logging of wind speed, wind direction,