Wind Energy Facts vs. Myths: Evidence, Trade-offs, and What Really Matters
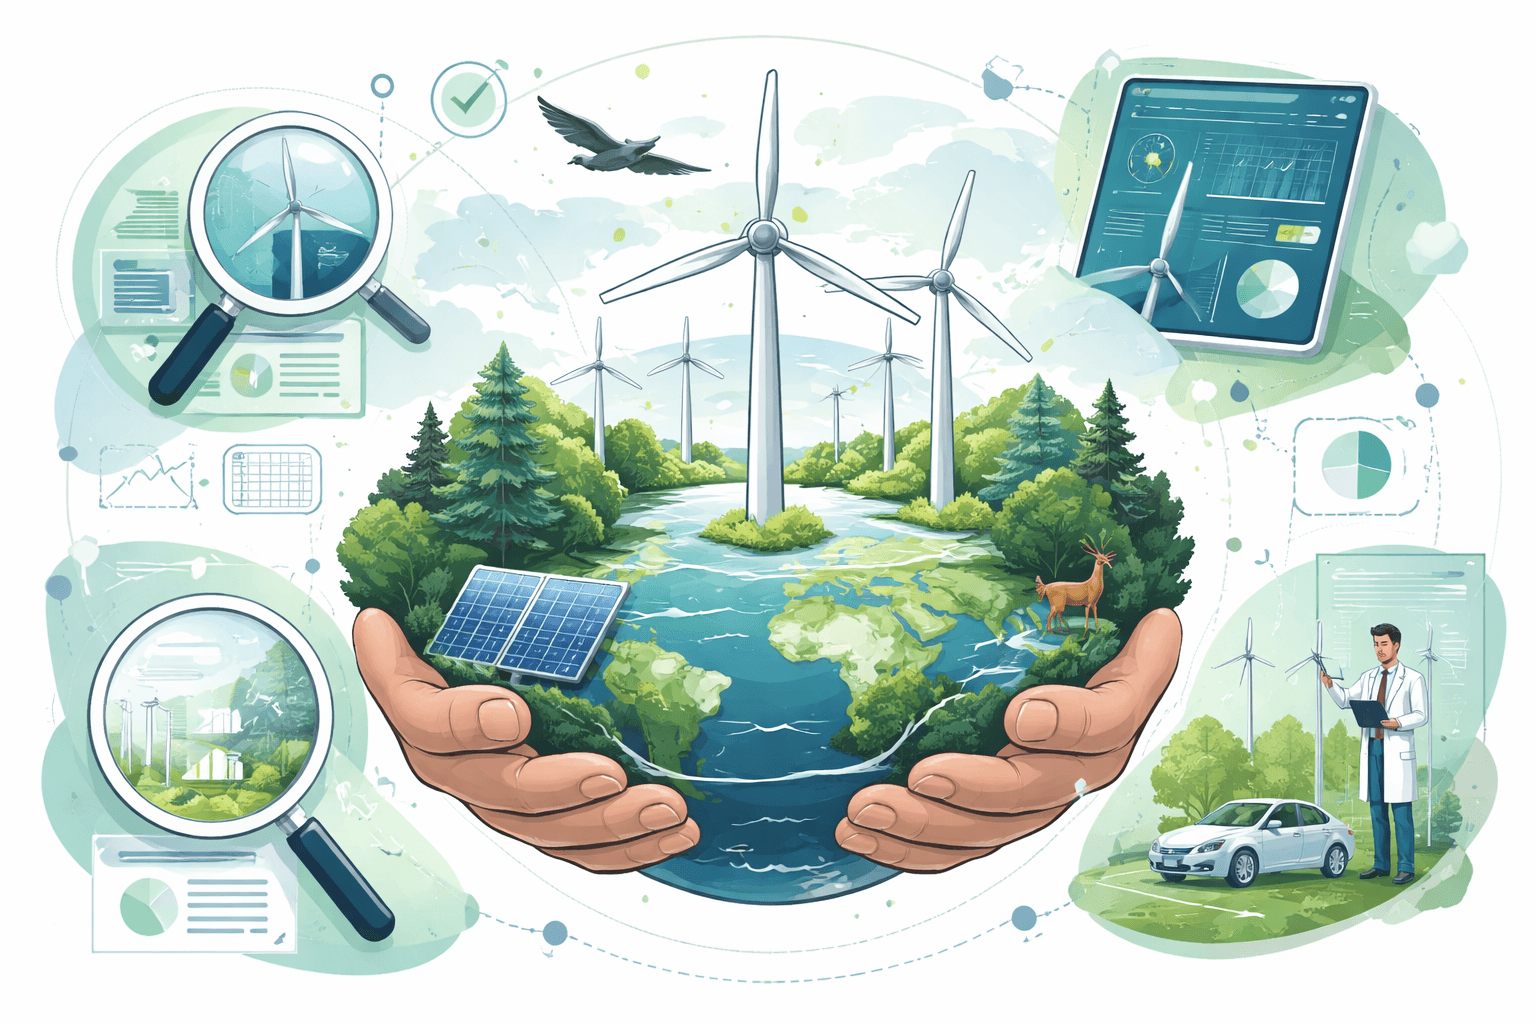
Wind crossed the one-terawatt mark of installed capacity in 2023, supplying roughly 8% of global electricity according to IRENA and Ember. As deployment accelerates, so do claims and counterclaims. This explainer separates wind energy facts and myths using the best-available data from IEA, IPCC, NREL, Health Canada, and peer‑reviewed research—acknowledging real trade-offs while focusing on what matters for grids, communities, and the climate.
The most persistent wind‑energy myths—and why they stick
Myths often persist because they contain a kernel of truth misapplied out of context or based on outdated data. Here are the big five, why they resonate, and what the evidence says.
Sustainable Energy - without the hot air: MacKay, David JC
Written by David MacKay, who was an esteemed Professor of Engineering at the University of Cambridge and Chief Scientific Advisor to the UK Department of Climate Change, this is <strong>an uplifting,
Check Price on AmazonMyth 1: “Wind is unreliable and needs 100% fossil backup”
Why it persists: People conflate capacity factor (the average output over time) with reliability (the ability of the grid to meet demand every second). Headlines during extreme weather events amplify the idea that when wind output drops, fossil plants must stand by one‑for‑one.
What the evidence says: Modern onshore wind projects often achieve 35–45% capacity factors (some U.S. Plains sites exceed 50%), while offshore averages 40–55% and higher in the North Sea. Grid reliability is a system property, not a single plant’s trait. System operators use a portfolio of resources—wind, solar, hydropower, existing thermal plants, storage, and demand response—spread across geography to meet demand. Studies by NREL and multiple ISOs show the “capacity credit” of wind (its reliable contribution at peak) typically ranges from 10–40% of nameplate depending on regional wind patterns and grid mix. Integration costs at moderate penetrations tend to be a few dollars per MWh—small compared with fuel savings from displacing gas and coal—when grids have transmission and flexible resources in place (NREL Western Wind and Solar Integration studies; IEA).
Myth 2: “Turbines kill huge numbers of birds”
Why it persists: Wildlife losses are real and visible at certain projects, and early wind sites were sometimes poorly located. Viral photos of raptors shape perception.
What the evidence says: Peer‑reviewed syntheses for the United States estimate wind turbines cause on the order of 140,000–328,000 bird fatalities annually (range varies by methodology). For context, building collisions kill an estimated ~365 million birds per year, vehicles tens to hundreds of millions, and domestic cats billions (Loss et al., 2013–2014; USFWS analyses). That does not minimize localized impacts: raptors and some migratory species can face elevated risk at specific sites. Effective siting, deterrents, and shutdown‑on‑demand protocols can significantly reduce fatalities. Repowering the Altamont Pass with fewer, modern turbines cut raptor deaths by roughly half to more than two‑thirds in monitoring reports. Bat mortality—especially for migratory tree bats—has been a larger concern at some sites; raising “cut‑in speed” by 1–2 m/s during high‑risk periods can reduce bat fatalities by 44–93% in field trials (Arnett et al.).
Myth 3: “Wind turbines make people sick”
Why it persists: Low‑frequency sound and shadow flicker can be annoying; annoyance correlates with sleep disturbance and stress. Individual negative experiences are compelling.
What the evidence says: Large epidemiological studies—including Health Canada’s 2014 Wind Turbine Noise and Health Study (1,238 participants)—found no direct causal link between wind turbine noise exposure and self‑reported illnesses, stress biomarkers, or blood pressure. The World Health Organization recognizes that environmental noise can affect well‑being; appropriate setbacks (commonly 500–1,000 meters depending on turbine size and local rules) and limits around 40 dBA at residences at night aim to minimize disturbance. Shadow flicker is typically managed to under 30 hours per year at any residence in jurisdictions that follow German guidelines, often far less with modern modeling and curtailment.
Myth 4: “Wind is secretly propped up by fossil fuels”
Why it persists: People observe that grids still use gas plants and assume they’re running “just for wind.”
What the evidence says: All power systems need reserves for contingencies (plant trips, demand spikes). Variable renewables add forecastable variability; operators respond with faster scheduling, regional coordination, storage, demand response, and some existing thermal flexibility. As wind and solar grow, the role of gas shifts from baseload to mid‑merit/peaking, operating fewer hours overall. Evidence from Denmark, Ireland, Spain, and U.S. regions shows high variable renewable shares can operate reliably with diversified portfolios and transmission. Grid‑scale batteries—now the fastest‑growing source of flexibility globally—are increasingly providing frequency response and peak shaving, reducing reliance on thermal reserves (IEA; multiple ISO reports).
Myth 5: “Wind is too expensive”
Why it persists: Older projects had higher costs; recent headlines about some offshore contract cancellations reinforced the view.
What the evidence says: Onshore wind is among the lowest‑cost new sources of electricity in many markets. Lazard’s Levelized Cost of Energy (LCOE) analysis (2024) estimates unsubsidized onshore wind at roughly $27–$73/MWh, competitive with combined‑cycle gas ($39–$101/MWh) and well below new coal ($68–$166/MWh). Offshore wind costs are higher and have risen recently with supply chain and interest rate shocks, but long‑term costs have trended down as turbine sizes and experience grow. Power‑purchase agreement prices also reflect location, grid constraints, and risk allocation; comparing LCOE across technologies requires consistent assumptions.
Wind energy facts: how it works, what it costs, and how it fits the grid
How turbines work—and why capacity factor isn’t “waste”
A wind turbine converts kinetic energy in moving air into electricity via rotor blades, a drivetrain (gearbox or direct‑drive generator), power electronics, and a control system that optimizes yaw and pitch. Larger rotors capture more energy at lower wind speeds, driving today’s higher capacity factors compared with earlier generations. Capacity factor—the average output divided by nameplate rating—reflects wind resource, turbine design, and operations. A 3‑MW turbine at a 40% capacity factor produces about 10.5 GWh per year; not “wasted capacity,” but the statistical reality of the resource. For a primer on the components and control systems, see our explainer: How Do Wind Turbines Work? Simple Explanation, Components & Facts.
Intermittency vs. variability—and proven integration tools
“Intermittent” implies sudden on/off. Wind is better described as variable and partly predictable. Day‑ahead and intra‑day forecasting routinely achieve low error rates when aggregated over regions. The portfolio effect—diverse sites, technologies, and weather patterns—smooths variability, while transmission expands diversity further. System operators integrate wind using:
- Transmission expansion and regional coordination to share resources across larger balancing areas
- Demand response to shift flexible loads (HVAC, EV charging, industrial processes)
- Fast‑ramping plants and hydropower for residual balancing
- Storage for frequency response, peak shaving, and energy shifting
Batteries now provide millisecond‑fast frequency regulation and multi‑hour shifting in high‑renewable regions from California to Australia. For a deeper dive into storage technologies and costs, see Energy Storage Explained: Types, Costs, and How It Powers the Grid.
Lifecycle emissions and carbon footprint
Wind’s greenhouse gas emissions are concentrated in materials (steel, concrete, fiberglass, copper, and—in some generators—rare‑earth magnets). The IPCC’s Sixth Assessment (2022) reports median lifecycle emissions for onshore and offshore wind around 12 gCO2‑e/kWh (interquartile ranges within roughly 7–56), compared with ~450 g for combined‑cycle gas and ~820–1,000 g for coal. As grids decarbonize steel and cement, wind’s embodied emissions fall further. Net of construction, typical wind projects “pay back” their carbon in a few months to under a year depending on the grid mix they displace.
Cost and performance trends
- Turbines have grown from 2–3 MW a decade ago to 5–7 MW onshore and 12–15 MW offshore in leading markets, boosting energy capture and reducing balance‑of‑plant costs per MWh.
- Onshore LCOE has fallen dramatically since 2010 (IRENA) with learning rates near 10%—each doubling of global capacity reduces costs roughly a tenth, on average—though local costs depend on siting, transmission, and financing.
- Offshore wind experienced inflationary pressure in 2022–2024, but auctions in Europe are adjusting design and risk allocation; larger rotor machines and standardized foundations are expected to restore cost declines as supply chains expand. For trends and the global build‑out, see Wind Energy Growth: Analyzing the Global Shift to Offshore Wind Farms.
By the numbers
- Global wind capacity: surpassed 1 terawatt in 2023 (IRENA)
- Share of global electricity: roughly 8% in 2023 (Ember/IEA)
- Typical capacity factors: 35–45% onshore; 40–55% offshore (higher in best sites)
- Lifecycle emissions: ~12 gCO2‑e/kWh for wind vs. ~450 gas and ~820–1,000 coal (IPCC AR6)
- LCOE (unsubsidized): onshore $27–$73/MWh; offshore $72–$140/MWh (Lazard 2024)
- Wildlife context (U.S. orders of magnitude): wind ~10^5 bird fatalities/year vs. buildings ~3.6×10^8 and cats ~10^9–10^10 (peer‑reviewed syntheses)
- Land footprint: 1–5% of a wind farm’s area is physically occupied; the rest often remains in agriculture or habitat (NREL)
- Jobs: about 1.4 million employed in wind globally (IRENA, Renewable Energy and Jobs 2023)
Real trade‑offs—and how to manage them
Wildlife and habitat
- Birds and bats: Local impacts can be significant for raptors, migratory tree bats, and species with narrow ranges. Best practices include high‑resolution pre‑construction surveys, avoiding flyways and nesting/roosting hotspots, turbine micro‑siting away from ridgelines and wetlands, smart curtailment (raising cut‑in speeds in high‑risk periods), seasonal shutdowns, and deterrent technologies (acoustic/ultrasonic for bats; radar‑triggered pauses for birds).
- Offshore ecology: Pile‑driving generates underwater noise; bubble curtains and vibro‑piling can mitigate. Construction windows avoid sensitive breeding or migration periods. Fishing interactions vary by gear type and local rules; long‑term monitoring in the North Sea finds many species adapt to artificial reef effects around foundations, though cumulative effects need continued study. Marine mammal protections require exclusion zones and monitoring.
- Cumulative impacts: Landscape‑scale planning across projects matters more than any single site; adaptive management and transparent post‑construction monitoring build trust and improve siting models.

Echo Meter Touch Bat Detector: Listen to, record and identify bats using the Echo Meter Touch hardware module - App on Amazon Appstore
View on AmazonLand use, viewsheds, and sound
- Space and co‑use: A 200‑MW wind farm might span tens of square kilometers, yet roads, pads, and substations occupy a small fraction of that area, allowing farming and grazing to continue.
- Visual impact: Turbines are tall and visible. Early and honest visualization, micro‑siting to reduce skyline clutter, setbacks from ridgelines and sensitive viewsheds, and community benefits (e.g., revenue sharing, property tax relief) improve acceptance.
- Sound and shadow flicker: Modern turbines are quieter than older models; typical modeled sound levels at residences comply with 35–45 dBA limits. Shadow flicker can be predicted precisely; many jurisdictions cap it at 8–30 hours/year with automatic curtailment. Health research supports annoyance mitigation through siting and engagement rather than framing turbines as direct health hazards.
Extech SDL600 - Sound Level Meter & Datalogger : Industrial & Scientific
View on AmazonMaterials, supply chain, and recycling
- Materials: A 3‑MW onshore turbine contains hundreds of tons of steel and concrete, 10–20+ tons of copper and aluminum across the array, and composite blades. Many modern generators use permanent magnets with neodymium and dysprosium; others use wound‑rotor designs that avoid rare earths. Responsible sourcing, recycling targets, and substitution (e.g., ferrite magnets, advanced steel laminations) can reduce impacts.
- End of life: 80–90% of a turbine’s mass (steel, copper, aluminum) is readily recyclable. Blades are the challenge: historically thermoset composites, they have been landfilled or co‑processed in cement kilns. New thermoplastic blades and recyclable resin systems are entering the market, and several regions are adopting landfill restrictions that push higher‑value recycling. Project decommissioning plans and financial surety (bonds) should be in place from day one.
- Repowering: Replacing older, smaller turbines with fewer, larger machines can increase energy output while reducing wildlife risk per MWh and retiring outdated infrastructure on the same footprint.
Practical takeaways: cut through noise, ask better questions, act locally
How to evaluate “facts” and statistics
- Check dates: Turbine sizes, costs, and practices change fast. A 2012 statistic may be obsolete.
- Define terms: Nameplate capacity (MW) vs. energy (MWh), capacity factor, LCOE vs. PPA price, lifecycle vs. operational emissions.
- Look for system studies: Grid reliability is about portfolios and transmission, not single plants. Seek assessments by IEA, NREL, national system operators, and peer‑reviewed journals.
- Watch for cherry‑picking: A single problematic site or an extreme weather week does not represent annual or multi‑region performance.
- Seek primary sources: Government agencies, standards bodies, and academic studies are stronger than unsourced blogs or advocacy graphics.
For a data‑driven comparison of resource profiles, see Is Wind Energy Better Than Solar? A Data-Driven Comparison.
Questions to ask about any local wind project
- Resource and performance: What capacity factor is expected? How many GWh/year? How was the wind resource measured (met masts, LIDAR) and for how long?
- Siting and setbacks: How far are turbines from residences? What are the modeled sound levels (dBA) and shadow flicker hours at each receptor?
- Wildlife: What pre‑construction surveys were done? What curtailment strategies and deterrents are committed? How will post‑construction monitoring be reported publicly?
- Grid integration: What transmission upgrades are needed? Will the project provide or contract for storage or demand response services? Any expected curtailment?
- Community benefits: What local tax revenues, lease payments, or community benefit funds are proposed? How are visual impacts being mitigated?
- End‑of‑life: Is there a decommissioning plan and financial surety? Will components be recycled, repowered, or reused?
Realistic expectations for wind’s role in decarbonization
- Onshore wind: The workhorse for low‑cost bulk power in windy regions; continued repowering will lift output without expanding land footprints.
- Offshore fixed‑bottom: High capacity factors near coastal load centers, especially in the North Sea and parts of Asia; costs sensitive to supply chains and finance but expected to benefit from scale and standardization.
- Floating offshore: Early‑stage with higher costs today; essential for deep‑water regions (Japan, U.S. West Coast, Mediterranean). Industrialization through the late 2020s–2030s could unlock steep learning curves.
- Complementarity: Wind and solar often peak at different times and seasons; combined with hydro, storage, and flexible demand, they can reliably serve most demand hours with far lower emissions.
Global scenarios from the IEA’s Net Zero Emissions pathway envisage wind providing a major share of electricity by mid‑century, but getting there requires parallel investment in transmission, storage, digitalization, and market design—along with careful siting and community engagement.
What individuals and communities can do
- Engage early: Attend planning meetings, ask for the data and the mitigations listed above, and push for transparent monitoring.
- Support grid upgrades: Transmission and interties make renewables more reliable and affordable; local backing matters.
- Choose clean power: Where available, opt into green tariffs or community wind shares to signal demand.
- Back evidence‑based siting: Encourage wildlife‑sensitive design, setbacks that meet health guidance, and repowering of older sites.
- Track performance: Ask developers and utilities to publish open data on output, curtailment, wildlife monitoring, and community benefits.
What really matters
The core wind energy facts are consistent across credible sources: modern wind is a low‑carbon, increasingly low‑cost power source with manageable variability and system‑level solutions for reliability. The real work is not debating whether wind “works”—it does—but ensuring it works well for people and nature: building transmission, planning at landscape scale, deploying storage and demand flexibility, investing in safer supply chains and recycling, and maintaining social license through genuine benefits and transparency.
For a refresher on turbine mechanics and grid roles, revisit How Do Wind Turbines Work? Simple Explanation, Components & Facts, our offshore build‑out analysis Wind Energy Growth: Analyzing the Global Shift to Offshore Wind Farms, and the flexibility toolkit in Energy Storage Explained: Types, Costs, and How It Powers the Grid.
Recommended Products
Sustainable Energy - without the hot air: MacKay, David JC
Written by David MacKay, who was an esteemed Professor of Engineering at the University of Cambridge and Chief Scientific Advisor to the UK Department of Climate Change, this is <strong>an uplifting,
Extech SDL600 - Sound Level Meter & Datalogger : Industrial & Scientific
<strong>Measures sound levels from 30 to 130 dB with high accuracy of approximately ±1.4 dB</strong> in compliance with ANSI and IEC 61672‑1 Type 2 standards
Echo Meter Touch Bat Detector: Listen to, record and identify bats using the Echo Meter Touch hardware module - App on Amazon Appstore
There are two models: Echo Meter Touch 2 (EMT 2) is <strong>intended for nature enthusiasts and batting hobbyists</strong> and Echo Meter Touch 2 Pro is designed for bat professionals and features a h