How Wind Turbines Work: The Science, Components, and Real‑World Impact
Wind power crossed the 1‑terawatt mark globally in 2023, adding a record ~117 GW in a single year, according to the Global Wind Energy Council. Yet a deceptively simple question still drives most searches: how wind turbines work. The short answer is aerodynamic blades harvest kinetic energy from moving air and turn it into electricity with high-efficiency generators and power electronics. The longer, more interesting answer involves physics, sophisticated control systems, grid integration, and real environmental tradeoffs.
How wind turbines work: from wind to watts
At the core of how wind turbines work is energy conversion. Moving air contains kinetic energy proportional to air density and the cube of wind speed. As wind flows over a turbine blade, the blade’s airfoil shape generates lift (a pressure difference between the two sides of the blade) and some drag. Lift dominates in modern designs, pulling the rotor around much like a wing creates lift on an airplane. That rotational energy is converted into electrical power by a generator in the nacelle (the housing at the top of the tower).

Wind Energy Explained: Theory, Design and Application: Manwell, James F., McGowan, Jon G., Rogers, Anthony L.
Wind Energy Explained: Theory, Design and Application [Manwell, James F., McGowan, Jon G., Rogers, Anthony L.] on Amazon.com. *FREE* shipping on qualifying offers. Wind Energy Explained: Theory, Desig
Check Price on AmazonKey physics and limits:
- Power in the wind: P_wind = 1/2 × ρ × A × v³, where ρ is air density (~1.225 kg/m³ at sea level), A is rotor swept area, and v is wind speed. Doubling wind speed increases available power eightfold.
- Betz limit: No turbine can capture more than 59.3% of the wind’s kinetic energy (the power coefficient, Cp ≤ 0.593). Modern utility‑scale rotors peak around Cp ≈ 0.45–0.5 under ideal conditions.
- Tip‑speed ratio (TSR): The ratio of blade tip speed to wind speed is typically 6–9 for large horizontal‑axis turbines, balancing aerodynamic efficiency and noise.
From torque to electricity:
- The rotor (blades + hub) converts aerodynamic lift into torque on a low‑speed shaft.
- Torque travels through a drivetrain: either a gearbox that steps up speed for a medium/high‑speed generator, or a direct‑drive configuration that couples the rotor to a low‑speed, large‑diameter generator.
- Variable‑speed operation keeps blades near their optimal angle of attack, maximizing power capture at changing wind speeds. Power electronics (converters) condition the output to match grid frequency and voltage.
Power curve and capacity factor:
- Turbines have characteristic operating points. Cut‑in speed is typically 3–4 m/s, below which the rotor won’t turn. Rated power is reached around 11–13 m/s onshore (lower offshore due to larger rotors). Cut‑out is around 25 m/s to protect components in storms.
- The power curve maps wind speed to electrical output. Because wind is variable, a turbine’s average output over time—the capacity factor—ranges ~30–45% onshore and 40–60% offshore in good sites (IEA). Bigger rotors and better controls have steadily pushed capacity factors higher.
For a deeper dive into real‑world tradeoffs and system impacts, see How Wind Power Works: The Science, Technology, and Real‑World Tradeoffs (/sustainability-policy/how-wind-power-works-science-technology-real-world-tradeoffs).
The main components and control systems
A modern utility‑scale turbine is a networked machine that continuously optimizes output while protecting itself from extreme loads.
- Blades: Typically 60–90 m long onshore and 100–130+ m offshore, made from glass‑ or carbon‑fiber reinforced polymers. The blade’s twist and taper keep angle of attack near optimal along its length. Internal spars and shear webs provide stiffness with minimal weight.
- Hub: The central casting that mounts the blades. Pitch bearings and actuators in the hub rotate each blade around its axis to control lift and loads.
- Drivetrain:
- Gearbox (most common onshore): Converts low‑speed, high‑torque rotor motion (10–20 rpm) to high‑speed shaft rotation (1,000–1,800 rpm) for a compact generator. Typical ratios are 80:1 to 120:1. Multi‑stage planetary/helical gearboxes balance efficiency and durability.
- Direct‑drive (more common offshore and in some onshore models): Eliminates the gearbox, using a large‑diameter permanent magnet generator running at rotor speed. Fewer moving parts can reduce maintenance, but the generator is heavier and requires large bearings and sophisticated cooling.
- Generator and power electronics:
- Doubly‑fed induction generators (DFIG) dominate many onshore fleets. A partial converter (≈30% of rated power) enables variable speed operation while coupling to the grid.
- Full‑converter synchronous generators (often permanent‑magnet) use 100% power electronics to completely decouple rotor speed from grid frequency, enabling advanced grid support and better fault ride‑through.
- Converters manage reactive power, voltage, and harmonics to meet grid codes.
- Nacelle: The housing containing the drivetrain, generator, yaw drive, cooling systems, and SCADA sensors. It also includes a transformer for medium‑voltage collection systems.
- Tower: 80–120 m typical onshore; 130–160 m+ for new designs to access stronger, steadier winds. Taller towers reduce shear effects and increase energy production.
- Foundation: Reinforced concrete spread footings onshore; monopiles, jackets, or suction buckets offshore. Foundations distribute loads from wind and rotor dynamics into the ground or seabed.
- Yaw system: Motors and a yaw bearing rotate the nacelle to face the wind, minimizing yaw misalignment that reduces power and increases fatigue.
- Pitch system: Electric or hydraulic actuators tweak blade pitch degrees per second to maximize Cp at low to moderate winds and to feather (reduce lift) at high winds for load control.
- Braking and safety:
- Aerodynamic braking via pitching to feather is primary.
- A mechanical disc brake on the high‑speed shaft provides a parking brake and emergency stopping at low speeds.
- Overspeed protection, lightning protection (receptors and down conductors), and fire detection are standard.
- Sensors and control:
- Anemometers and wind vanes atop the nacelle guide yaw and basic control.
- Strain gauges, accelerometers, shaft torque sensors, and temperature probes feed supervisory control and data acquisition (SCADA) systems.
- Condition monitoring (vibration, oil debris analysis) enables predictive maintenance, often cutting unplanned downtime by 10–20% in field studies (NREL, DNV).
For a concise walkthrough of each part, see How Do Wind Turbines Work? Simple Explanation, Components & Facts (/renewable-energy/how-do-wind-turbines-work-simple-explanation-components-facts).
Turbine types and scales: why they matter
Horizontal vs. vertical axis:
- Horizontal‑axis wind turbines (HAWTs): Nearly all utility‑scale machines. Rotor faces upwind with a tubular tower. High aerodynamic efficiency, mature supply chains, and proven controls.
- Vertical‑axis wind turbines (VAWTs): Darrieus and Savonius types. Omnidirectional and mechanically simpler at small scale, but lower peak efficiency (lower Cp), higher fatigue loads, and historically poor track records at utility scale. Active research continues for urban and niche applications.
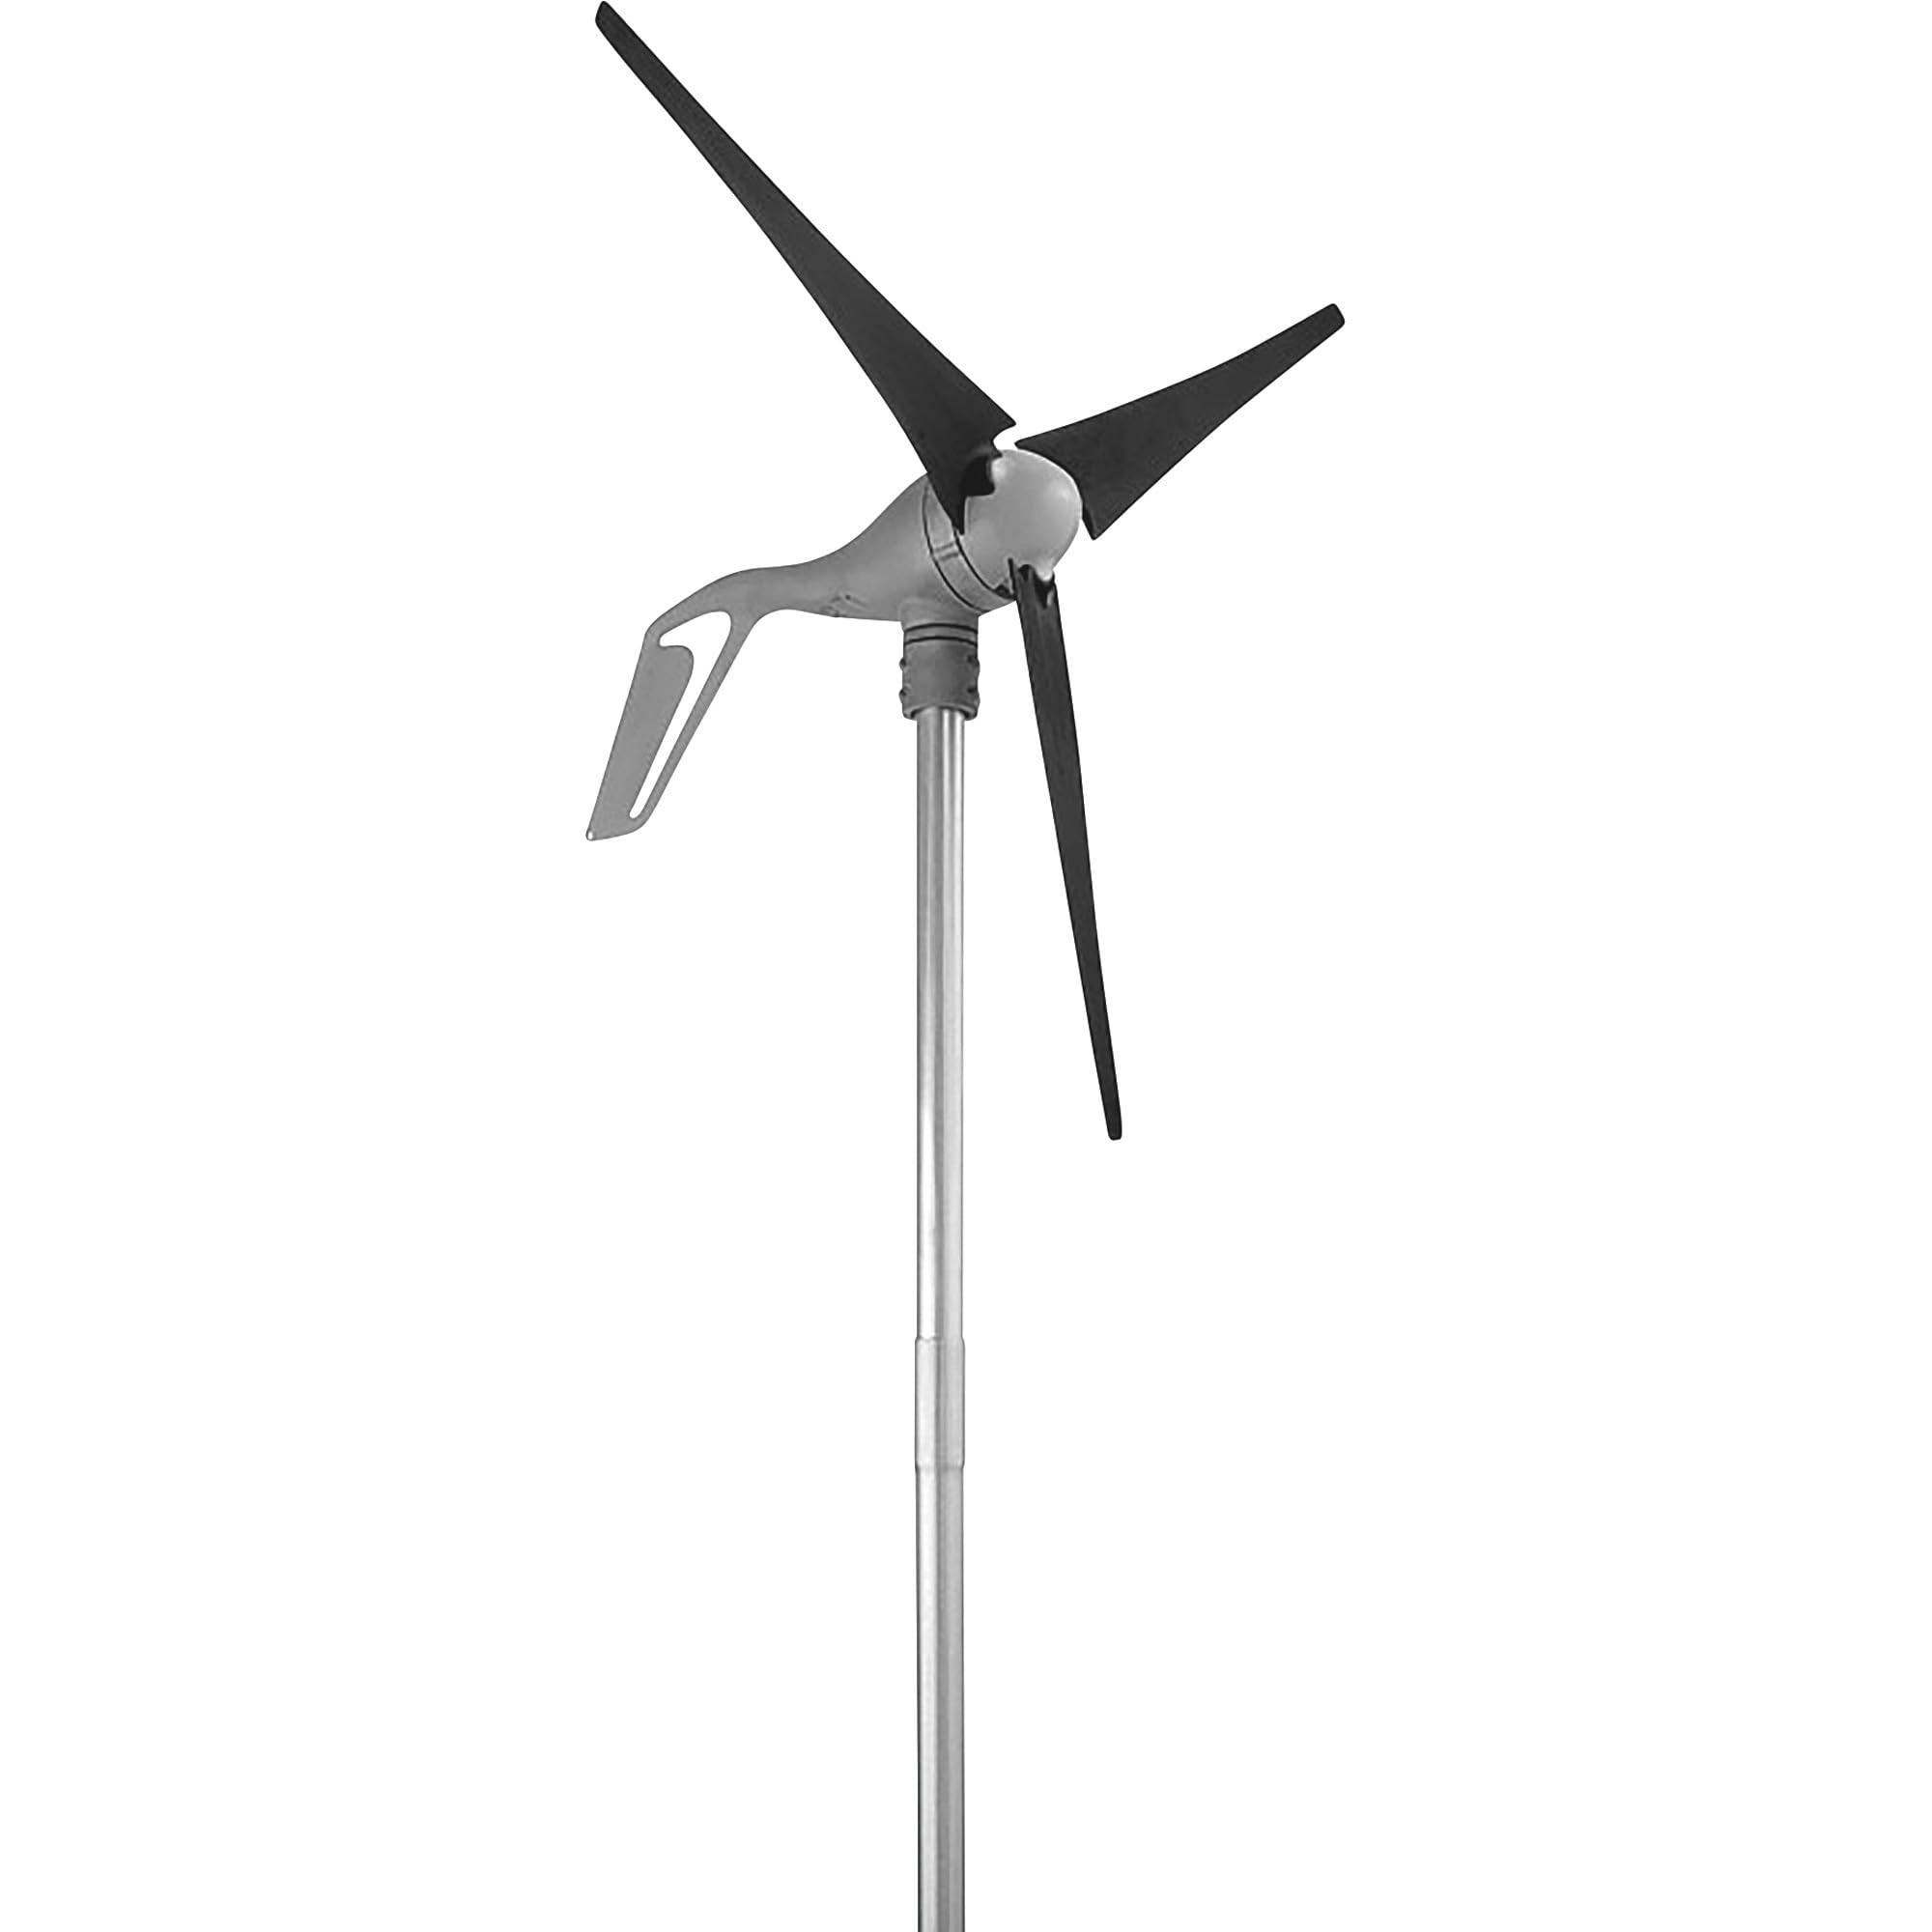
Primus Wind Power 1-AR40-10-12 Air 40 Wind Turbine 12V : Patio, Lawn & Garden
View on Amazon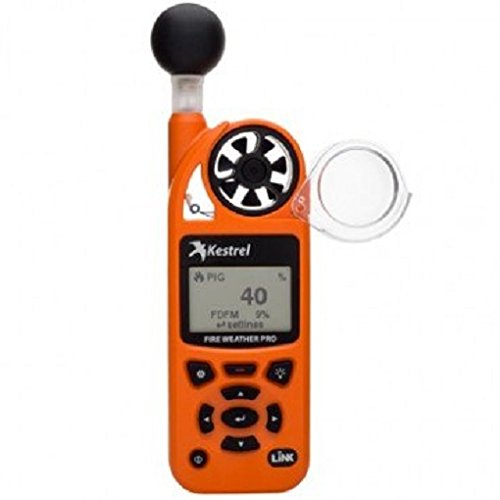
Kestrel 5500 Weather Meter with Link and Vane Mount, Olive Drab : Patio, Lawn & Garden
View on AmazonOnshore vs. offshore:
- Onshore dominates installations by capacity, with typical ratings of 3–6 MW per turbine in new projects and hub heights up to 120–160 m. Capacity factors in strong interior wind belts often exceed 40%.
- Offshore leverages stronger, steadier winds with larger rotors and higher capacity factors (often 45–60%). Turbines now commonly span 12–15 MW with 220–260 m rotor diameters. Fixed‑bottom foundations suit depths to ~60 m; floating platforms (semi‑submersible, spar, tension‑leg) open deeper waters. Demonstrations like Hywind Scotland have reported capacity factors above 50% in multiple years (Equinor).
Utility‑scale vs. distributed/small wind:
- Utility‑scale projects interconnect at medium or high voltage, delivering hundreds of megawatts as wind farms. Plant‑level controls coordinate wake steering, reactive power, and ramp rates.
- Distributed wind includes single turbines on farms, businesses, or microgrids. Ratings range from 5 kW to 100s of kW, with hub heights of 15–40 m. Performance hinges on siting clear of obstructions; turbulence and shear in the built environment can slash output. For homeowners and small businesses, see Small Wind Turbine Guide for Homes: Cost, Size & Best Models (/renewable-energy/small-wind-turbine-guide-homes).
Siting and resource assessment:
- Developers measure wind with met masts (anemometers at multiple heights) and remote sensing (LiDAR/SODAR) for at least 12–24 months. They model terrain, roughness, and wakes using computational fluid dynamics and mesoscale weather data.
- The International Electrotechnical Commission (IEC) classifies turbines by wind speed and turbulence to match machines to sites, reducing fatigue and extending life.
Offshore market dynamics are evolving quickly; for the latest trends and project scale, see Wind Energy Growth: Analyzing the Global Shift to Offshore Wind Farms (/renewable-energy/wind-energy-growth-global-offshore-wind-farms).
Grid integration and operational realities
Intermittency and variability:
- Wind is variable but increasingly predictable at the fleet level. Day‑ahead and intra‑day forecasts from numerical weather prediction models reduce reserve needs, while spatial diversity smooths output across regions.
Power smoothing and curtailment:
- Turbines and wind plants provide active power control, limiting ramps and following setpoints from grid operators. Plant controllers coordinate dozens to hundreds of turbines to respect grid constraints and transmission limits.
- Curtailment—intentionally reducing output due to congestion or oversupply—occurs in most markets but is typically a single‑digit share of potential generation where transmission keeps pace with build‑out (IEA). New lines, dynamic line ratings, and grid‑enhancing technologies reduce curtailment.
Ancillary services and grid codes:
- Modern wind plants provide reactive power and voltage support, low‑voltage ride‑through (LVRT), and frequency response via power electronics. “Synthetic inertia” and fast frequency response come from extracting kinetic energy from rotating masses and modulating converter output within seconds.
- Grid‑forming converters are being piloted to provide stable voltage and frequency in low‑inertia systems, enabling higher renewable shares and even black‑start capabilities in demonstration projects.
Storage and hybrids:
- Co‑located batteries mitigate variability, capture value during price spikes, and provide reserves. In the U.S., utility‑scale battery capacity surpassed 15 GW in 2023 (EIA), with hybrid wind‑battery plants expanding.
- Wind–solar hybrids exploit complementary diurnal patterns; solar peaks midday, while many wind regimes strengthen evenings and nights. Shared interconnection and balance‑of‑plant lower costs.
Environmental and practical impacts—and what’s next
Wildlife and noise:
- Avian and bat impacts vary by region and species. U.S. Fish & Wildlife Service and peer‑reviewed studies estimate bird fatalities from wind to be orders of magnitude lower than from buildings, vehicles, and domestic cats, though site‑specific risks remain. Adaptive strategies—micro‑siting away from flyways, smart curtailment during low‑wind bat activity, and deterrents—can reduce bat mortality by 50–80% in studies (e.g., Arnett et al.).
- Sound levels at typical residential setbacks (300–500 m) are commonly in the 35–45 dBA range—comparable to a quiet library. Modern serrated trailing edges, lower tip speeds, and refined controls reduce aeroacoustic noise.
Land and seascape:
- The physical footprint of onshore turbines is small—often ~1–2% of the leased area, allowing agriculture or grazing between turbines. Offshore visual and ecological impacts depend on siting, depth, and foundation type; careful baseline surveys and monitoring are now standard in permitting.
Lifecycle emissions and materials:
- Lifecycle greenhouse gas intensities for wind are among the lowest of any energy source: typically 7–14 g CO₂‑equivalent per kWh across meta‑analyses (IPCC, NREL). Most emissions come from materials and construction; turbines offset this “carbon debt” within months to a year of operation, depending on the grid mix.
- Blade end‑of‑life is a challenge due to thermoset composites. Solutions include co‑processing in cement kilns, mechanical recycling, and new recyclable resins. Manufacturers have introduced recyclable blades using modified epoxy or thermoplastic matrices; scaling these chemistries is a near‑term industry priority.
Maintenance and repowering:
- Turbines are designed for 20–30 years, but components like gearboxes, bearings, and converters require mid‑life overhauls. Predictive analytics and condition monitoring cut costs and increase availability, often above 97% at utility scale.
- Repowering—replacing nacelles and blades on existing towers or installing fewer, larger turbines—can boost energy yield 20–40% at mature sites while reusing grid and civil infrastructure.
Emerging innovations:
- Larger rotors and taller towers: Rotor diameters onshore are moving beyond 170 m, with hybrid and wood‑composite towers reducing weight and embodied carbon.
- Advanced aerodynamics: Downwind rotors, active load control (flaps or distributed pitch), and wake steering via intentional yaw misalignment increase plant‑level energy by a few percent—valuable at fleet scale.
- Power electronics: Grid‑forming inverters and fast synthetic inertia improve stability and enable islanded or weak‑grid operation.
- Floating offshore wind: Semi‑submersible and spar platforms unlock deep‑water resources—over half of the world’s offshore wind potential lies in depths beyond fixed‑bottom limits (IEA). Serial manufacturing, modular moorings, and dynamic cables aim to cut costs.
- Materials and recyclability: Thermoplastic blades, recyclable resins, and increased use of carbon fiber in targeted sections improve strength‑to‑weight and end‑of‑life options.
By the numbers
- 1+ terawatt: Global cumulative wind capacity in 2023 (GWEC)
- 3–4 m/s: Typical cut‑in wind speed; ~11–13 m/s: rated; ~25 m/s: cut‑out
- 0.593: Betz limit for maximum theoretical energy capture; ~0.45–0.5: modern peak Cp
- 30–45%: Onshore capacity factor in strong sites; 40–60% offshore (IEA)
- 60–90 m: Typical onshore blade length today; 100–130+ m offshore
- 80–160 m: Common hub heights; taller towers reach steadier winds and higher yield
- Single‑digit percent: Typical curtailment in well‑planned markets (IEA)
- 7–14 g CO₂e/kWh: Wind lifecycle emissions (IPCC, NREL)
Practical implications for consumers, businesses, and policymakers
- Consumers: Understanding how wind turbines work clarifies why output varies seasonally and daily, and why wind pairs well with solar and storage to deliver 24/7 clean energy portfolios.
- Businesses: Corporate PPAs increasingly source from wind due to high capacity factors overnight and winter peaks, complementing solar. Hybrid projects can improve hedge performance and grid value.
- Policymakers and grid planners: Transmission expansion, grid‑forming inverter standards, and coordinated interconnection queues are critical to reduce curtailment and maintain reliability as wind’s share grows. Wildlife‑smart siting, monitoring, and adaptive curtailment protect biodiversity while enabling rapid deployment.
For evidence‑based myths and tradeoffs that often surface in public debates, see Wind Energy Facts vs. Myths: Evidence, Trade-offs, and What Really Matters (/sustainability-policy/wind-energy-facts-vs-myths-evidence-trade-offs).
What to watch next
- Turbine scaling: Expect incremental jumps in rotor diameter and hub height onshore, with 15+ MW class machines becoming standard offshore as supply chains stabilize.
- Software‑defined wind farms: Plant‑level optimization, wake steering, and predictive O&M driven by high‑fidelity sensing and AI will lift fleet capacity factors and reduce LCOE.
- Grid‑forming capabilities: Converter‑dominated grids will require more wind plants to operate in grid‑forming mode, contributing to voltage and frequency stability rather than merely following.
- Circularity: Blade recyclability and low‑carbon materials will move from pilot to procurement specs, shrinking the footprint of each kWh generated.
- Floating wind commercialization: Serial manufacturing and standardized moorings/cables could push floating into double‑digit gigawatt deployments by the early 2030s, tapping vast deep‑water resources.
If you’re deciding between residential wind and other options, or simply want a compact refresher after this deep dive into how wind turbines work, our residential guides and offshore analyses linked above offer targeted next steps.
Recommended Products
Wind Energy Explained: Theory, Design and Application: Manwell, James F., McGowan, Jon G., Rogers, Anthony L.
Wind Energy Explained: Theory, Design and Application [Manwell, James F., McGowan, Jon G., Rogers, Anthony L.] on Amazon.com. *FREE* shipping on qualifying offers. Wind Energy Explained: Theory, Desig
Kestrel 5500 Weather Meter with Link and Vane Mount, Olive Drab : Patio, Lawn & Garden
Once mounted, the Kestrel 5500 ... – with <strong>a large wind vane and precision pivot keeping the Kestrel oriented into the wind for continuous measurement and logging of wind speed, wind direction,
Primus Wind Power 1-AR40-10-12 Air 40 Wind Turbine 12V : Patio, Lawn & Garden
<strong>Tower kits are available</strong>. Output and Specs: Maximum output of the wind turbine is 160 watts, exporting roughly 40 KW Hrs per month in average 12 mph wind regimes (or approximately 110