Plastic Pollution Explained: Causes, Impacts, and What You Can Do
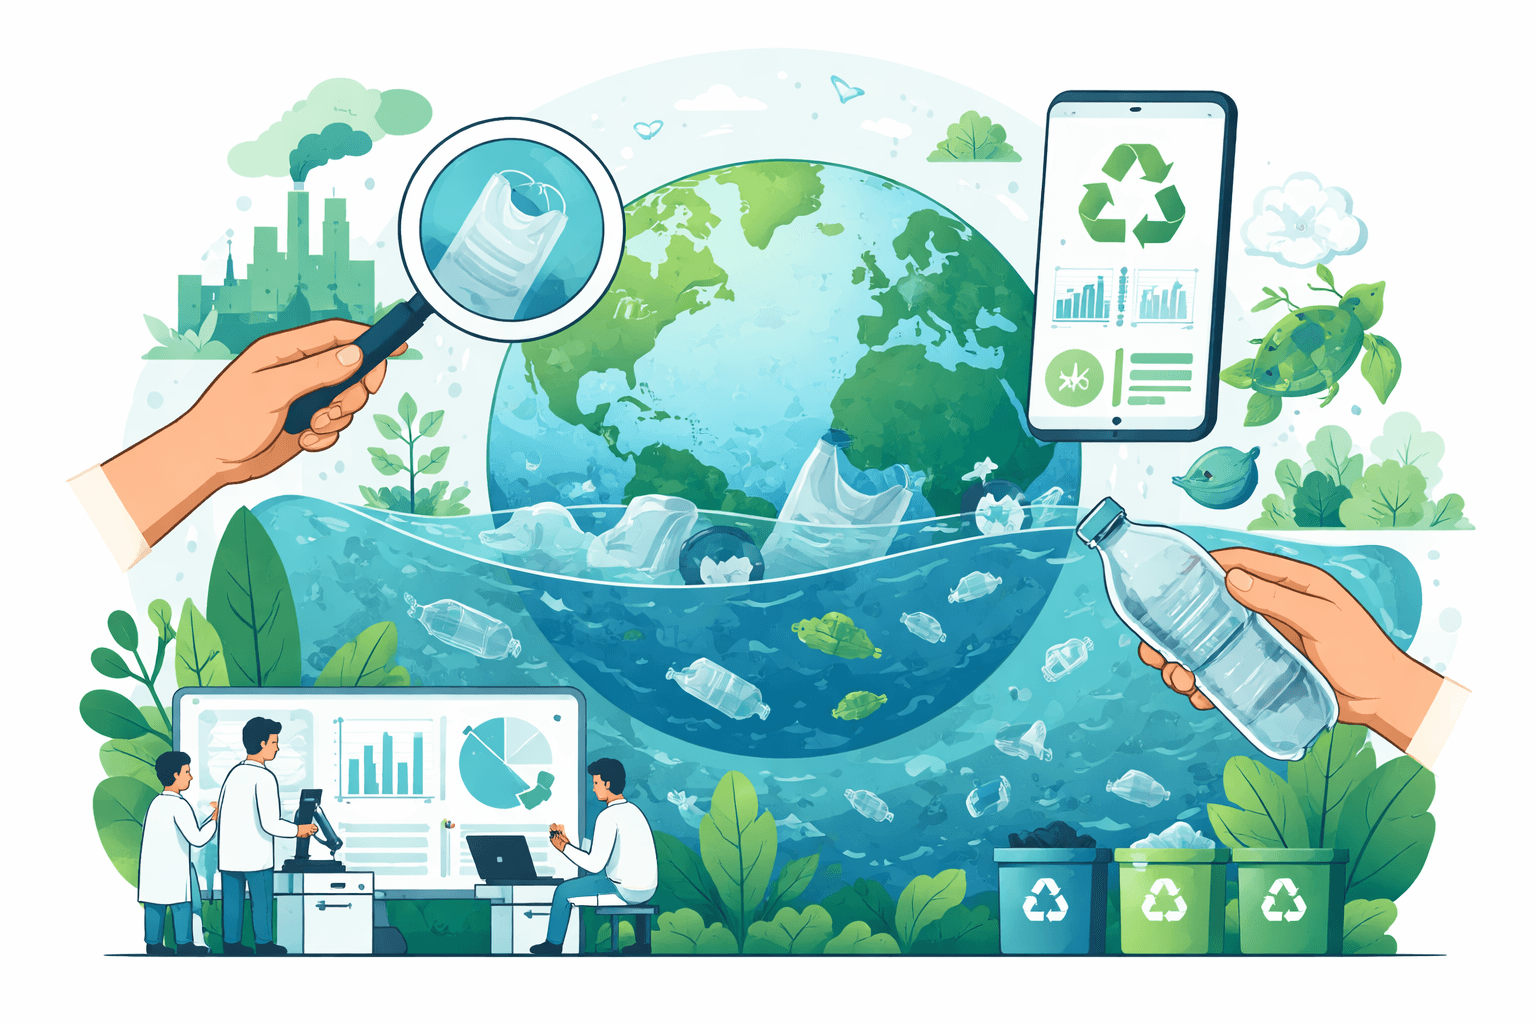
Plastic pollution has moved from shoreline litter to a systems challenge shaping climate, health, and biodiversity. In 2022, the world produced roughly 400 million metric tons of plastics (PlasticsEurope), and between 6–11 million tons entered rivers and oceans in a single year (OECD 2022; UNEP/Pew 2020). Without action, that annual ocean flow could nearly triple by 2040 (Pew & SYSTEMIQ, “Breaking the Plastic Wave,” 2020).
What is plastic pollution? Definitions, types, and lifecycle
Plastic pollution refers to plastics—synthetic polymers and their additives—leaking into the environment where they persist and fragment. It spans size classes and sources:
- Macroplastics: larger than 5 mm (bottles, bags, fishing nets)
- Microplastics: smaller than 5 mm, including
- Primary microplastics intentionally made small (e.g., preproduction pellets or “nurdles,” microbeads, tire and road wear particles, synthetic textile fibers)
- Secondary microplastics formed when larger items fragment under sunlight, heat, and mechanical abrasion
- Nanoplastics: typically defined as particles below about 1 micrometer in size; these can cross biological membranes and are difficult to measure consistently
Lifecycle matters because leakage risk varies at each stage:
- Feedstock and resin production: About 99% of plastics are fossil-based. Plastics’ lifecycle emissions reached ~1.8 gigatons CO2e in 2019 (OECD 2022), and petrochemicals are the largest driver of future oil demand growth (IEA).
- Conversion and use: Packaging is the largest end-use at ~40% of demand in many regions (PlasticsEurope), dominated by single-use formats with short lifetimes.
- End-of-life: Of all plastic waste generated historically up to 2015, only 9% was recycled, 12% incinerated, and 79% landfilled or leaked into the environment (Geyer, Jambeck & Law, Science Advances 2017). Collection and sorting are pivotal bottlenecks.
Sources and pathways: from production to rivers and coasts
Plastic pollution is not only a marine issue; most leakage begins on land, then moves through watersheds.
- Single-use plastics: Items designed for minutes of use—bags, sachets, cutlery, multilayer snack packs—dominate litter audits in many countries. Lightweight, flexible formats are hard to collect and often unrecyclable.
- Mismanaged waste: Open dumping and uncontrolled landfills allow wind and runoff to carry plastic into waterways. The World Bank’s What a Waste 2.0 shows that in low-income countries more than 90% of waste can be openly dumped or inadequately managed.
- Rivers as conveyors: Modeling and field data indicate that about 80% of ocean-bound plastic from land comes from roughly 1,000 rivers, many small and near cities (Meijer et al., Science Advances 2021). Monsoon seasons and flood pulses sharply increase flux.
- Fisheries and aquaculture: Lost, abandoned, or discarded fishing gear (“ghost gear”) is a high-impact marine source. In the Great Pacific Garbage Patch (GPGP), 46% of the mass is fishing nets (Lebreton et al., Scientific Reports 2018).
- Microfibers and microbeads: Each load of synthetic clothing can release hundreds of thousands of fibers (Napper & Thompson 2016). IUCN (2017) estimates primary microplastics to the oceans are dominated by synthetic textiles (~35%) and tire wear (~28%).
- Industrial pellets: Spills of preproduction pellets (nurdles) during manufacturing and transport are a persistent, preventable leakage pathway.
By the numbers: plastic pollution, at a glance
- 400 million metric tons: Global plastics production in 2022 (PlasticsEurope)
- 6.1 million metric tons: Plastic leaked to rivers and oceans in 2019 (OECD 2022); other assessments estimate ~11 million tons/year to the ocean (UNEP/Pew 2020)
- 9%: Cumulative share of plastic waste ever recycled up to 2015 (Geyer et al. 2017)
- 1.6 million km²: Estimated area of the Great Pacific Garbage Patch; mass ~79,000 tons (Lebreton et al. 2018)
- 80%: Share of ocean-bound plastic from land delivered by ~1,000 rivers (Meijer et al. 2021)
- 35% and 28%: Shares of primary microplastics from textiles and tire wear, respectively (IUCN 2017)
Scale and impacts: ecosystems, economies, and health
Scale. Plastics use has outpaced any other bulk material in the last half-century. OECD (2022) estimates global plastics use at ~460 Mt in 2019 and waste generation at ~353 Mt, with only ~9% recycled that year and 22% mismanaged. Without system change, annual ocean inputs could reach 23–37 Mt by 2040 (Pew 2020; UNEP 2023), as consumption grows and waste infrastructure lags.

A Poison Like No Other: How Microplastics Corrupted Our Planet and Our Bodies: Simon, Matt
“Informed, utterly blindsiding ... “Journalist Matt Simon’s urgent new book A Poison Like No Other: <strong>How Microplastics Corrupted Our Planet and Our Bodies</strong> is classified as environmenta
Check Price on AmazonEcological impacts are measurable and mounting:
- Ingestion and entanglement: Over 900 marine species are affected by plastic debris through ingestion or entanglement (UNEP). Modeling suggests that by 2050, 99% of seabird species will have ingested plastics (Wilcox et al., PNAS 2015). Sea turtles and marine mammals suffer lethal and sublethal effects from nets, lines, and films.
- Habitat and disease: Coral reefs in contact with plastic are 20 times more likely to develop disease (Lamb et al., Science 2018), compounding climate-driven bleaching stress.
- Food webs: Microplastics are found from plankton to tuna. Laboratory and field studies report reduced feeding, altered growth, and energy allocation in invertebrates and fish when exposed to microplastics and associated chemicals.
Human health and exposure:
- Microplastics are found in bottled and tap water, air, and foods like shellfish. Atmospheric transport deposits microplastics even in remote parks and wilderness—an estimated >1,000 metric tons per year across U.S. protected areas (Brahney et al., Science 2020).
- Human biomonitoring detected plastic particles in blood (Leslie et al., Environment International 2022) and placenta (Ragusa et al., Environment International 2021). Toxicological significance at real-world doses remains under active study, but inhalation and ingestion represent plausible exposure routes.
- Chemicals: Plastics contain additives (phthalates, bisphenols, flame retardants) and can sorb persistent organic pollutants. Distinguishing particle effects from chemical effects is a key research frontier.
Economic costs: UNEP (2023, “Turning off the Tap”) estimates the environmental and social costs of plastic pollution and its associated greenhouse gases in the hundreds of billions of dollars annually, through lost fisheries and tourism revenue, flooding from clogged drains, and cleanup burdens on municipalities.
Hotspots and case studies
Great Pacific Garbage Patch (GPGP). Synthesizing aerial and net trawl data, Lebreton et al. (2018) estimate the GPGP spans ~1.6 million km² and contains ~1.8 trillion pieces weighing ~79,000 tons, with a composition skewed to fishing gear by mass. Concentrations are orders of magnitude higher than surrounding waters, creating a macroplastic hotspot but also a source of ongoing microplastic generation through fragmentation.
Riverine contributors. Global modeling identifies the Ganges system, the Yangtze, and highly urbanized, shorter rivers such as the Pasig (Philippines) among top contributors by flux (Meijer et al. 2021). Characteristics associated with high leakage include dense populations near waterways, high rainfall, and low waste collection coverage.
Urban microplastics. Stormwater is a dominant pathway. In San Francisco Bay, researchers estimate that trillions of microplastic particles—dominated by tire wear—enter via storm drains each year (San Francisco Estuary Institute, 2019). Similar findings now appear in London’s Thames and other urban estuaries, suggesting that road runoff control is as critical as shoreline cleanup.
Remote deposition. Even where no plastic is produced or used locally, winds carry microfibers and fragments. Brahney et al. (2020) documented widespread airborne deposition of microplastics across U.S. national parks, underscoring that solutions must address both local litter and diffuse, atmospheric pathways.
Solutions at scale: policy, circularity, and market signals
Evidence indicates that a portfolio of measures can dramatically cut plastic pollution using tools available today.
- Extended Producer Responsibility (EPR): Under EPR, producers fund and meet recovery and recycling targets for the packaging they place on the market. OECD members have rolled out EPR for packaging, electronics, and more, increasing collection rates and creating stable financing for reuse and recycling systems.
- Bans and standards: More than 120 countries have enacted some form of single-use plastics regulation, from bag charges to bans on straws, stirrers, and expanded polystyrene foodware (UNEP). Microbeads bans are now widespread. The EU’s Single-Use Plastics Directive sets design requirements (e.g., tethered caps), recycled-content mandates for beverage bottles, and litter reduction targets.
- Deposit return systems (DRS): Adding a refundable deposit to beverage containers routinely drives 80–95% return rates. Germany’s DRS recovers ~98% of PET bottles, and Lithuania achieved >90% return within two years of launching its system (Reloop, “Global Deposit Book”). High return rates increase high-quality recyclate supply and reduce litter.
- Global Plastics Treaty: UN member states are negotiating a legally binding instrument to end plastic pollution across the full lifecycle (the INC process). Potential provisions include virgin production controls, design standards, and financing mechanisms for waste infrastructure.
- Waste system buildout: Expanding basic collection coverage, controlled disposal, and sorting capacity in emerging economies yields immediate leakage reductions. The World Bank estimates each dollar invested in solid waste management can avert multiple dollars in downstream flooding and health costs.
- Circular economy design: Shift to reuse and refill systems where feasible; design for recyclability (e.g., mono-material packaging, fewer pigments and fillers); and increase post-consumer recycled (PCR) content. The Ellen MacArthur Foundation’s Global Commitment shows brands increasing PCR use but still far from 2025 goals for reusable/recyclable/compostable packaging—accelerated design change is needed.
Pew and SYSTEMIQ (2020) conclude that combining reduction, substitution, reuse, recycling, and safe disposal can cut annual ocean plastic flows by about 80% by 2040 compared to business-as-usual—without relying on speculative technologies.
Technologies and innovation: cleanup, materials, and AI
Cleanup and capture:
- River interceptors and trash wheels: Interception at river mouths delivers outsized gains. Baltimore’s “Mr. Trash Wheel” fleet has captured more than 2,000 tons of debris since 2014, preventing it from entering the Chesapeake Bay (Healthy Harbor Initiative reports).
- Booms and net traps: Modular devices in canals and small rivers can be rapidly deployed, especially during rainy seasons when flux spikes. Maintenance and safe waste handling are essential to avoid re-release.
- Ocean cleanup: Offshore collection targets macroplastic hotspots like the GPGP. While visible and valuable for research, offshore cleanup is energy-intensive and should complement—not replace—source reduction and river interception.
Materials and recycling:
- Mechanical recycling improvements: High-yield sorting (NIR spectroscopy), better design-for-recycling, and food-grade rPET capacity expansion are scaling.
- Chemical/advanced recycling: Pyrolysis (turning polyolefins into oils), solvolysis, and enzymatic depolymerization (e.g., PET back to monomers) can address hard-to-recycle streams. They remain energy-intensive and capital-heavy; transparent mass-balance claims and lifecycle assessments are vital to ensure true emissions and leakage reductions.
- Biobased and biodegradable polymers: PLA and PHA can reduce fossil demand in select applications. Most “compostable” plastics require industrial composting conditions (e.g., EN 13432) and may not degrade in marine environments; clear labeling and collection systems are prerequisites to avoid contamination.
Monitoring and data:
- Satellites and drones: Machine learning on Sentinel-2 and other sensors can detect large plastic accumulations on water (Biermann et al., Science Advances 2020) and map illegal dumping sites on land.
- Sensors and AI: Computer vision on conveyor belts improves sorting purity; IoT fill-level sensors optimize bin collection. See practical tools in Using Technology for Environmental Protection: Tools, Impacts, and Practical Guidance (/sustainability-policy/using-technology-for-environmental-protection-tools-impacts-practical-guidance).
Practical actions: what individuals, communities, and businesses can do
Individuals
- Target the top five: beverage bottles, bags, cups/lids, takeout containers, and utensils. Switching to reusables can eliminate 100–300 single-use items per person per year, depending on habits and local norms.
- Choose durable, repairable goods and minimal packaging. In OECD countries, plastics use averages ~221 kg per person per year (OECD 2022); shifting just 10% of packaging demand to reuse/refill can cut several kilograms per person annually.
- Wash smarter: Use cold, full loads, liquid detergents, and slower spin cycles to reduce microfiber shedding; consider a lint filter or wash bag designed for synthetic fibers.
- Recycle correctly: Contamination can ruin whole bales. Follow local rules and learn common pitfalls in How to Recycle Effectively: Practical Guidance to Reduce Waste and Avoid Contamination (/sustainability-policy/how-to-recycle-effectively-practical-guidance).
Communities and cities
- Close leakage points: Install storm drain filters and curb inlet screens; prioritize hot spots identified by litter audits. Track kilograms captured per storm event and per linear kilometer of roadway.
- Launch deposit-return or bring-back pilots at events and in public spaces; measure return rates monthly.
- Run data-driven cleanups. Standardize reporting (e.g., items and weight per volunteer-hour) to identify priority products and locations. For event playbooks, see Practical Tips for Organizing a Successful Community Recycling Drive (/sustainability-policy/tips-for-organizing-a-recycling-drive).
- Build local recycling capacity and markets. Explore baling, drop-off hubs, and partnerships with regional MRFs; quantify diversion in tons/year and contamination rates. For planning, see Plastic Recycling Program Guide: Practical Planning, Operations, Markets, and Measurement (/sustainability-policy/plastic-recycling-program-guide-planning-operations-markets-measurement).
Businesses and institutions
- Design for circularity: Eliminate problematic materials (e.g., PVC in packaging, carbon black pigments that hinder sorting), use mono-materials, and meet minimum PCR-content targets—e.g., 30% rPET in PET bottles where food safety allows.
- Set leakage KPIs: Track “virgin resin intensity” (kg per $ revenue), packaging weight per unit, return/reuse rates, and post-consumer collection achieved via EPR or voluntary take-back.
- Pilot reuse/refill: In foodservice, deploy reusable cup/tote systems with RFID tracking; aim for >80% return within two weeks. In retail, test refill stations and concentrate formats.
- Engage suppliers: Adopt pellet loss prevention (Operation Clean Sweep), require design-for-recycling specs, and audit for compliance.
- Communicate transparently: Publish annual packaging footprints and progress, aligned with the Ellen MacArthur Foundation’s Global Commitment metrics. For examples of ambitious programs, explore Circular Economy Leaders: How Companies Are Eliminating Waste (/green-business/circular-economy-leaders-companies-eliminating-waste).
Where plastic pollution is heading—and what will bend the curve
Three dynamics will shape the next decade:
- Production growth vs. policy constraints: Planned petrochemical expansions could lock in higher virgin resin capacity. Robust treaty outcomes, recycled-content mandates, and EPR can decouple consumption from leakage.
- Data and targeting: Satellite analytics, citizen science, and standardized metrics will improve hotspot identification and accountability, shifting funding toward the highest-return interventions (e.g., river interception before monsoon seasons).
- Business model innovation: Reuse-as-a-service, design-for-repair, and material passports will expand, especially where regulation prices externalities and infrastructure supports circular flows.
Combining upstream reduction, midstream system fixes, and downstream cleanup can deliver rapid gains. The evidence base is clear: with today’s tools, countries can cut plastic leakage dramatically within a few years while generating jobs, reducing flooding, and improving public health.
Resources, data sources, and further reading
- OECD (2022). Global Plastics Outlook: Economic Drivers, Environmental Impacts and Policy Options.
- UNEP (2023). Turning off the Tap: How the world can end plastic pollution and create a circular economy.
- Pew Charitable Trusts & SYSTEMIQ (2020). Breaking the Plastic Wave.
- Geyer, R., Jambeck, J., Law, K. (2017). Production, use, and fate of all plastics ever made. Science Advances.
- Lebreton, L. et al. (2018). Evidence that the Great Pacific Garbage Patch is rapidly accumulating plastic. Scientific Reports.
- Meijer, L. et al. (2021). More than 1,000 rivers account for 80% of global riverine plastic emissions to the ocean. Science Advances.
- IUCN (2017). Primary Microplastics in the Oceans: A Global Evaluation of Sources.
- Lamb, J. et al. (2018). Plastic waste associated with disease on coral reefs. Science.
- Wilcox, C. et al. (2015). Threat of plastic pollution to seabirds is global, pervasive, and increasing. PNAS.
- Brahney, J. et al. (2020). Plastic rain in protected areas of the United States. Science.
- Leslie, H. et al. (2022). Discovery and quantification of plastic particle pollution in human blood. Environment International.
- Ragusa, A. et al. (2021). Plasticenta: First evidence of microplastics in human placenta. Environment International.
- San Francisco Estuary Institute (2019). Microplastic in San Francisco Bay.
- Reloop (latest). What We Know About Deposit Return Systems: Global Deposit Book.
For step-by-step project ideas and measurement tips at the local level, see Plastic Recycling Projects: Practical Ideas, Costs, and Measurable Impact (/sustainability-policy/plastic-recycling-projects-practical-ideas-costs-measurable-impact).
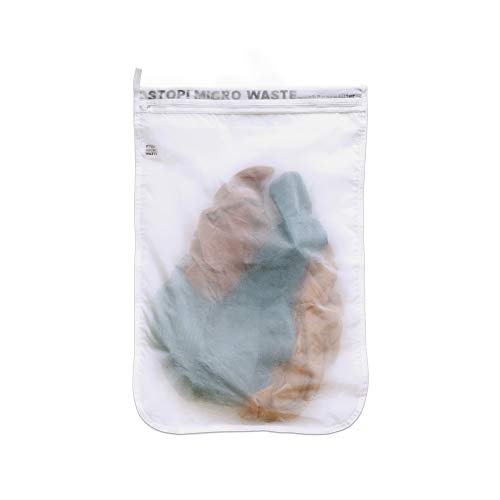
Washing Bag Guppyfriend
View on Amazon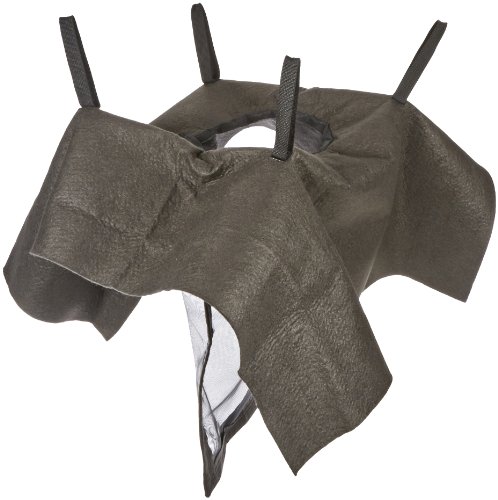
UltraTech 9227 Ultra-Drain Trash and Debris Guard, 48" Length x 36" Width x 18" Height: Science Lab Spill Containment Supplies: Amazon.com: Industrial & Scientific
View on AmazonRecommended Products
A Poison Like No Other: How Microplastics Corrupted Our Planet and Our Bodies: Simon, Matt
“Informed, utterly blindsiding ... “Journalist Matt Simon’s urgent new book A Poison Like No Other: <strong>How Microplastics Corrupted Our Planet and Our Bodies</strong> is classified as environmenta
Washing Bag Guppyfriend
Shoe Washing Machine Bag: Laundry ... Guppyfriend washing bag is <strong>the pioneering solution to prevent microplastic fibers from polluting rivers and oceans during the washing of synthetic textile
UltraTech 9227 Ultra-Drain Trash and Debris Guard, 48" Length x 36" Width x 18" Height: Science Lab Spill Containment Supplies: Amazon.com: Industrial & Scientific
Helps comply with NPDES, 40 CFR 122.26 (1999) when used as Best Management Practice in Stormwater Pollution Prevention Plans. Installation: Easily installed in most drains. To do it, simply raise the
More in Sustainability Policy
- Ocean Plastic Pollution Solutions: Practical Ways to Stop Waste from Reaching the Sea
- Plastic Recycling Projects: Practical Ideas, Costs, and Measurable Impact
- Why Recycling Plastic Matters: Environmental, Economic and Health Benefits
- Plastic Recycling Program Guide: Practical Planning, Operations, Markets, and Measurement