Plastic Recycling Program Guide: Practical Planning, Operations, Markets, and Measurement
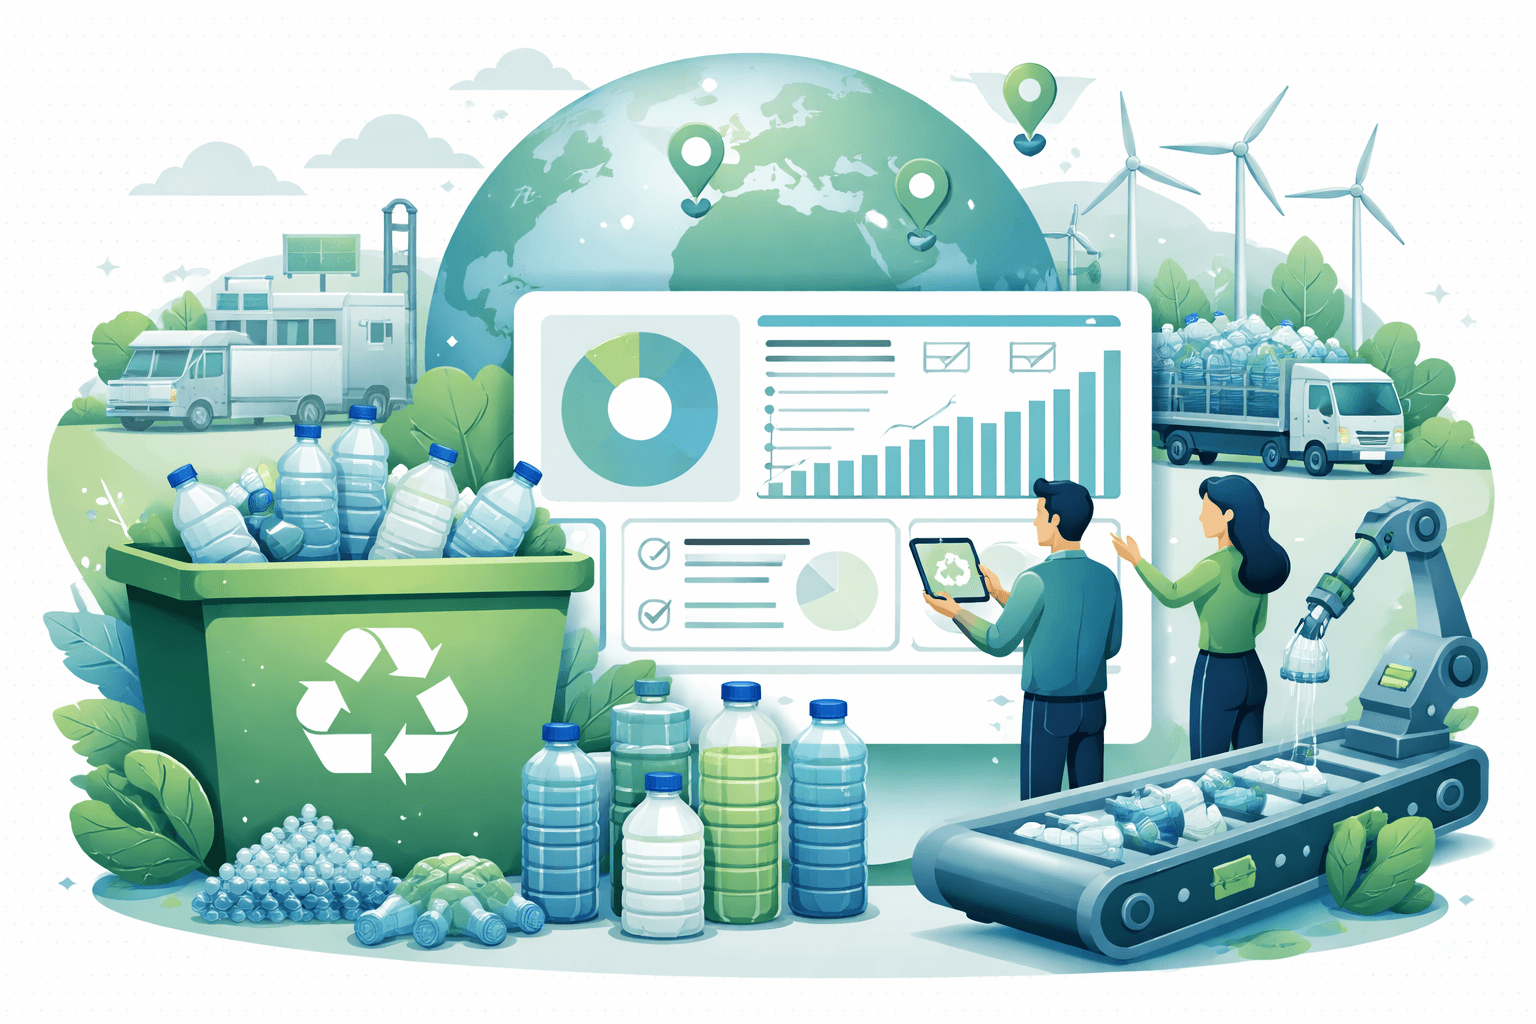
Globally, only about 9% of plastic waste is recycled, according to the OECD’s Global Plastics Outlook (2022). In the U.S., the Environmental Protection Agency’s last full characterization (2018) estimated an 8.7% plastic recycling rate, while independent analyses put 2021’s rate closer to 5–6%. That gap between potential and performance is exactly what a well‑designed plastic recycling program can close. This plastic recycling program guide lays out a data‑driven playbook—from setting goals and defining which resins to collect, to right‑sizing operations, securing end markets, leveraging funding, and measuring outcomes.
By the numbers
- 9%: Share of global plastic waste recycled (OECD, 2022)
- 5–9%: Range of U.S. plastic recycling rates reported across recent years (EPA, 2018; independent analyses 2021–2022)
- ~17%: Average inbound contamination for U.S. curbside single‑stream programs (The Recycling Partnership, 2020–2022 reports)
- 60–90%: Typical return rates for deposit‑return (bottle bill) systems, which dramatically improve PET/HDPE capture (Reloop/CRI compilations)
- 1–2 tCO2e: Lifecycle greenhouse gas savings per ton of plastic recycled versus virgin production, depending on resin and process (EPA WARM model factors)
Plastic Recycling Program Guide: Goals, Benefits, and Material Scope
Integrated Solid Waste Management: Engineering Principles and Management Issues: Tchobanoglous, George, Theisen, Hilary, Vigil, Samuel
by George Tchobanoglous (Author), Hilary Theisen (Author), Samuel Vigil (Author) & 0 more · <strong>A junior/senior-level introductory text aimed at civil and environmental engineers taking a basi
Check Price on AmazonSet goals that connect environmental and economic outcomes
Define what success looks like in year 1, year 3, and year 5. Examples:
- Environmental: divert X tons of plastic/year; reduce contamination below Y%; cut GHG emissions by Z tCO2e using EPA WARM factors.
- Economic: achieve net cost/ton below a threshold; reach revenue/ton targets via bale sales; avoid disposal fees by N dollars.
- Service quality: participation rate ≥60%; set‑out rate ≥40% on collection weeks; customer contamination warnings drop by half.
Frame goals around local realities—population density, hauling distances, existing materials recovery facilities (MRFs), and end‑market proximity all drive costs and capture.
Understand regional market realities before you set your material list
Not all plastics are equal from a recycling and market standpoint. Prioritize resins with strong, proximate end markets and stable pricing. A practical hierarchy:
- PET (#1) bottles and jars: Widely accepted; strong domestic markets for fiber, sheet, and food‑grade rPET when quality is high. Optical sorting and decontamination (super‑clean/SSP) enable food‑contact applications.
- HDPE (#2) bottles and jugs: High value; “natural” (unpigmented) HDPE commands premium prices for bottle‑to‑bottle; mixed‑color HDPE supports pipe, lumber, and non‑food packaging.
- PP (#5) rigid containers: Markets have grown in recent years; many MRFs now produce PP bales with support from industry initiatives. Requires adequate volume and optical sort capacity.
- PS (#6) and EPS foam: Niche markets; clean, densified EPS can move, but contamination, food residues, and economics are challenging. Consider targeted drop‑off with on‑site densification rather than curbside.
- PVC (#3): Generally excluded due to chlorine content and contamination risk to other streams; limited, specialized markets.
- LDPE/LLDPE films and bags (#4): High contamination risk in curbside systems and causes “tanglers” at MRFs. Viable via clean, segregated back‑of‑house collection (retail, warehouses) or specialty drop‑off; curbside only with robust controls and a partner MRF equipped for film recovery.
- Mixed #3–#7 bales: Post‑China’s National Sword policy, markets are limited and volatile. Only consider if your MRF and nearby buyers can meet quality specs and secure consistent outlets.
Why these choices matter: end markets pay for quality and consistency. Bales with low outthrows and low moisture sell faster, travel shorter distances, and deliver the highest avoided‑disposal value.
Collection and Processing: Operational Options, Costs, and Technology
Choose a collection model that matches your density and budget
- Curbside single‑stream (all recyclables in one cart): Highest participation and convenience; requires a MRF to sort; typically sees higher inbound contamination (~17% average). Best in urban/suburban areas with route density and access to a capable MRF.
- Curbside dual‑stream (fibers separated from containers): Lower contamination and better material quality, but more complex collection logistics. Viable where quality premiums offset added handling.
- Drop‑off centers: Lower operating costs and contamination when staffed; effective in rural areas or as complements to curbside for specialty plastics (films, EPS). Add signage and clear resin‑type bins.
- Commercial/back‑of‑house capture: Work with retailers, distribution centers, and institutions to collect clean films and rigids at scale. Often the most cost‑effective way to recycle LDPE films.

Toter 79296-R1200 96 Gallon Black Trash Can with Wheels and Attached Lid
View on AmazonEquipment and route design basics:
- Carts: 64–96‑gallon rolling carts with lids reduce windblown litter and keep materials dry. RFID‑enabled carts can track participation and enable feedback.
- Trucks: Side‑loaders for automated collection; split‑body trucks support dual‑stream. Route density and payload utilization drive cost/stop.
- Transfer: For longer hauls to a MRF, plan transfer stations to consolidate loads and reduce per‑ton transport cost.
Processing pathways: MRF vs. manual sorting vs. hybrid
- Full‑scale MRF: For single‑stream, you’ll need screens, magnets/eddy current separators (for metals), optical sorters for PET/HDPE/PP, quality control stations, and balers. Capital‑intensive but yields commodity bales with higher recovery.
- Manual sorting lines: Lower capital; viable for drop‑off or dual‑stream with lower throughput. Labor availability and safety training are critical. Manual QC stations are essential even in automated MRFs.
- Hybrid models: Combine targeted drop‑off (e.g., films, EPS) with MRF processing of PET/HDPE/PP from curbside. This often maximizes quality where tanglers are a risk.
Technology choices that scale with volume:
- Optical sorters: Near‑infrared (NIR) units identify resins by spectral signature; modern systems can also recognize black plastics and sort by color. They increase throughput and purity, but require consistent feed and maintenance. Many facilities add dedicated PP optics as volumes grow.
- Balers: Choose channel balers with auto‑tensioning for higher densities. Typical PET/HDPE bale weights range roughly 700–1,200 lb; consistent bale density and size reduce freight costs and rejections.
- Densifiers (for EPS): Thermal or hydraulic densifiers cut shipping volumes by 80–90%, making limited EPS markets reachable.
- Quality control: Vision systems, belt scales, and moisture meters help track purity and yield. Data from these systems should feed your KPIs.
- Chemical/advanced recycling: Depolymerization for PET and solvent‑based or pyrolysis routes for polyolefins are expanding in North America. These facilities have specific feedstock purity and volume requirements and local permitting considerations. Engage early to align specs; note that lifecycle performance and costs vary, and projects remain unevenly distributed geographically (see DOE/NREL BOTTLE Consortium and industry reports).
Contamination reduction tactics that work
- Clear, consistent “yes/no” lists that match your MRF’s actual capabilities; emphasize shape (“bottles, jugs, and tubs”) along with resin number.
- Keep it empty, clean, and dry: Light rinsing and draining reduce food residues and odors; moisture can lead to bale downgrades.
- Caps on, bags out: Many PET/HDPE programs now prefer caps on bottles to capture PP/HDPE closures; never bag recyclables unless your MRF specifically requires it. Films and cords create tangles and downtime.
- Feedback at the cart: “Oops tags” and cart‑side education have cut contamination 20–40% in documented community pilots (The Recycling Partnership case studies). Pair with social‑norm messaging and multilingual materials.
- Keep dangerous items out: Batteries, electronics, and propane cylinders cause fires and injuries at MRFs; promote safe alternatives. For residents, see our guides on safer drop‑offs and e‑waste: Safer Recycling Methods: Practical Steps to Protect People, Property, and the Planet and How to Recycle Electronics: A Practical Guide to Safe, Responsible E‑Waste Disposal.
For community‑facing basics on proper sorting, share this resource: How to Recycle Effectively: Practical Guidance to Reduce Waste and Avoid Contamination.
End Markets, Specifications, Logistics, and Contracts
Know your buyer’s spec—and design upstream to meet it
End‑market buyers (reclaimers, manufacturers) generally reference specifications from the Association of Plastic Recyclers (APR) and the Institute of Scrap Recycling Industries (ISRI). Common themes:
- PET bales: Limits on PVC, paper, metals, and other outthrows; food and oil residues penalized. Clear PET fetches higher prices than green/mixed.
- HDPE bales: “Natural” HDPE (unpigmented) kept separate from colored; color sort improves value. Prohibitions on paper/cardboard, metals, and films.
- PP bales: More sensitive to food residues and paper; minimum percentage of rigid PP required.
- Films: Strict cleanliness and moisture limits; post‑commercial preferred over post‑consumer. Sorted by color and grade (A/B/C film).
Work backward from these specs to set your accepted items, education, and QC protocols. Contamination and moisture penalties can erase commodity value.
Storage, baling, and freight logistics
- Keep bales dry and off the ground; water adds weight and leads to microbial growth and buyer rejections.
- Separate bale grades (PET, natural HDPE, colored HDPE, PP) and label with production dates and line.
- Optimize bale densities to fill van trailers or railcars efficiently; consistent dimensions reduce freight costs and damage.
- Fire safety: Plastic bales are combustible; implement separation distances, thermal monitoring, and rotation to minimize risk.
FLIR C5 Compact Thermal Imaging Camera with Wifi: ...
<strong>One - Thermal Imaging Camera for iOS Smartphones (iPhone 15 and Newer w/USB-C), 240x180 Super Resolution (80x60 Native IR)</strong> · One - Thermal Imaging Camera for Android Smartphones (USB-
Check Price on AmazonPricing dynamics and risk management
Plastic bale prices correlate with oil and virgin resin prices, policy shifts (e.g., recycled content mandates), and regional demand. Expect volatility. Practical contracting tools:
- Index‑linked pricing: Tie bale prices to published indexes (e.g., regional averages) with a transparent adjustment formula.
- Floors and ceilings: Protect both parties from extremes; pair with quality bonuses/penalties.
- Revenue‑share with MRFs/haulers: Align incentives for higher quality and throughput.
- Title transfer and deductions: Specify when ownership shifts and how moisture/contamination deductions are applied.
Recycled‑content policies can strengthen local demand. For example, California requires minimum post‑consumer recycled content in PET beverage bottles (AB 793: 15% by 2022, rising to 25% by 2025 and 50% by 2030), supporting rPET pricing and investment.
Form durable partnerships
- Processors/reclaimers: Visit facilities; confirm capacity, feedstock preferences, contamination tolerance, and off‑take stability.
- Haulers: Align on routing, set‑out monitoring, and cart tagging. Consider performance‑based compensation for contamination reductions.
- Manufacturers: Explore offtake MOUs for local end uses (e.g., rHDPE drainage pipe, rPET thermoforms) to shorten haul distances and stabilize demand.
- EPR/municipal programs: In states with packaging extended producer responsibility (EPR) or deposit systems, producer responsibility organizations (PROs) can co‑fund infrastructure, provide education templates, and set standardized acceptance lists. As of 2024, Maine, Oregon, Colorado, and California have enacted packaging EPR frameworks; deposit systems operate in 10 U.S. states with return rates that significantly outperform non‑deposit regions.
For inspiration on how companies are investing in circular systems, see Circular Economy Leaders: How Companies Are Eliminating Waste.
Funding, Policy Tools, Engagement, and Measurement
Funding sources and policy levers
- Federal grants (U.S.): EPA’s Solid Waste Infrastructure for Recycling (SWIFR) and Recycling Education and Outreach grants (funded by the Infrastructure Investment and Jobs Act) support MRF upgrades, carts, contamination reduction, and data systems.
- State programs: Many states (e.g., CalRecycle, MassDEP, NYSDEC) offer grants or no‑interest loans for carts, transfer stations, optical sorters, and market development.
- Producer funding: In EPR states, PROs cover a portion of system costs and education; in non‑EPR states, brand and industry coalitions sometimes co‑fund PP/PET sortation upgrades.
- Local ordinances: Pay‑as‑you‑throw (PAYT) can shift economics toward diversion by aligning residential fees with disposal volume; recycled‑content and procurement mandates create steady demand for rPlastics.
- Institutional partnerships: Hospitals, universities, and distribution centers can co‑invest in compactors/densifiers for clean streams (e.g., LDPE film), increasing volumes and revenue.
Build a capital plan that pairs grants with phased investments—e.g., start with carts and education, then add optical PP sorting when volumes justify, followed by film recovery or EPS densification if a buyer is secured.
Community engagement and education that boosts participation
- Message mapping: Use 3–5 core messages, repeated across carts, mailers, social media, and bill inserts. Keep acceptance lists aligned with MRF capabilities and avoid “wishcycling” language.
- Language access: Provide materials in the top languages spoken locally; use icons and photos of accepted items.
- Feedback loops: Tag contamination at the cart and follow up with text/email reminders; include positive reinforcement for “good sorters.”
- Events and schools: Host MRF tours, repair/reuse fairs, and classroom sessions tied to science standards.
- Equity: Ensure multifamily buildings receive equal service; tailor strategies for high‑turnover neighborhoods and student housing.
Metrics, KPIs, and audit practices for continuous improvement
Track and publish a concise metrics dashboard:
- Participation rate: Share of households setting out recyclables at least once in a defined period.
- Set‑out rate: Share of households setting out recyclables on a given collection day.
- Capture rate by resin: Tons of PET/HDPE/PP captured divided by estimated tons available in the waste stream (from composition studies).
- Inbound contamination rate: Non‑recyclables as a percent of inbound tons; target continuous reduction.
- Outbound bale purity: Non‑conforming material percentage; tie to pricing bonuses.
- Residue rate at MRF: Share of inbound material sent to disposal; a proxy for process efficiency.
- Cost per ton (gross and net): Include collection, processing, and revenue from material sales; compare to avoided disposal.
- GHG impact: tCO2e avoided using EPA WARM; report by resin where possible.
Audit practices that ground‑truth your numbers:
- Waste composition studies: At program launch, then every 2–3 years—or after major changes (new carts, education pushes). Sample single‑ and multi‑family routes separately.
- Route‑level sampling: Periodic visual checks or automated image analytics to flag hotspots for contamination or low participation.
- MRF inbound/outbound audits: Jointly develop sampling protocols with your MRF to verify bale quality, moisture, and outthrows.
- Market verification: Quarterly check‑ins with buyers to confirm specs, pricing adjustments, and any emerging contaminants of concern (e.g., full‑wrap shrink labels on PET, colored PET, or compostable look‑alikes).
Cost‑aware scaling roadmap
- Phase 1 (0–12 months): Launch/refine education; standardize carts; align acceptance list with MRF specs; start route‑level feedback; secure grants.
- Phase 2 (12–24 months): Add optical sort capacity for PP if volumes justify; pilot staffed drop‑off for films/EPS with densification; establish index‑linked contracts with floors/ceilings.
- Phase 3 (24+ months): Expand commercial/back‑of‑house film capture; explore chemical recycling partnerships where geographically and environmentally justified; integrate advanced analytics for contamination detection.
What this means for decision‑makers
- Municipal leaders: Start with PET/HDPE rigids, invest in carts and education, and measure relentlessly. Use grants and indexed contracts to de‑risk upgrades.
- MRF operators: Prioritize optical QC and bale tracking; publish transparent specs; align contamination penalties with education support.
- Brands and producers: Commit to long‑term offtake and recycled‑content targets; support design‑for‑recycling and local infrastructure investments.
- State and regional agencies: Pair recycled‑content mandates with market development grants and standardized acceptance lists; advance EPR frameworks that reward performance and equity.
Where plastic recycling programs are heading
Three market forces will shape the next decade:
- Policy alignment: Standardized acceptance lists, EPR, deposit‑return expansion, and recycled‑content mandates are catalyzing stable demand and better quality. Programs that align early with these frameworks will capture funding and market premiums.
- Technology maturation: Smarter optics, AI‑enabled QC, and better data systems will reduce residue, improve bale purity, and cut operating costs. Chemical recycling will find its place for hard‑to‑recycle streams where lifecycle benefits are demonstrable and local permitting supports it.
- Design for recycling: APR‑aligned packaging, fewer problematic labels/colors, and mono‑material formats will raise real‑world recyclability. As packages become easier to sort and reprocess, PET, HDPE, and PP recovery rates can meaningfully climb.
With clear goals, realistic material targets, tight contamination control, and market‑smart contracting, plastic recycling programs can turn today’s 5–9% recycling rates into far higher capture—cutting emissions, saving disposal costs, and building local circular economies that work in practice as well as on paper.
Recommended Products
Integrated Solid Waste Management: Engineering Principles and Management Issues: Tchobanoglous, George, Theisen, Hilary, Vigil, Samuel
by George Tchobanoglous (Author), Hilary Theisen (Author), Samuel Vigil (Author) & 0 more · <strong>A junior/senior-level introductory text aimed at civil and environmental engineers taking a basi
Toter 79296-R1200 96 Gallon Black Trash Can with Wheels and Attached Lid
Full content visible, double tap to read brief content. ... The Toter residential curbside heavy duty trash can is a <strong>2-wheeled garbage container with a molded-in axle and attached lid</strong>
FLIR C5 Compact Thermal Imaging Camera with Wifi: ...
<strong>One - Thermal Imaging Camera for iOS Smartphones (iPhone 15 and Newer w/USB-C), 240x180 Super Resolution (80x60 Native IR)</strong> · One - Thermal Imaging Camera for Android Smartphones (USB-
More in Sustainability Policy
- Plastic Recycling Projects: Practical Ideas, Costs, and Measurable Impact
- How to Recycle Waste Effectively: Practical Guidance to Reduce Contamination and Maximize Recovery
- Why Recycling Plastic Matters: Environmental, Economic and Health Benefits
- How to Set Up a Local Recycling Initiative: Practical Steps to Start, Run, and Sustain Community Recycling