Protecting Wildlife Habitats: A Practical Guide to Conservation, Technology, and Action
Wildlife habitats and conservation are inseparable: protect the places species need, and biodiversity, climate resilience, and human well‑being follow. The Intergovernmental Science-Policy Platform on Biodiversity and Ecosystem Services (IPBES) estimates around 1 million species are at risk of extinction, with land- and sea-use change the top driver. Forests still cover 31% of Earth’s land (FAO 2020), yet wetlands have declined by about 35% since 1970 (Ramsar 2018). This guide distills what habitats do, what’s threatening them now, which conservation approaches work, and how science and technology are making protection more effective and measurable.
Types of wildlife habitats and the services they provide
Habitats anchor ecosystems—the webs of species interactions and physical processes that sustain life. Each habitat type hosts characteristic wildlife and delivers distinct “ecosystem services” (the benefits nature provides to people), from water filtration to carbon storage and coastal protection.
Conservation Planning: Informed Decisions for a Healthier Planet
“In Conservation Planning: Informed Decisions for a Healthier Planet, Craig Groves and Ed Game have produced <strong>a well organized, easy to read account of pragmatic approaches to safeguarding crea
Check Price on AmazonForests
- Key species: From boreal caribou and Siberian tiger to Amazonian jaguar, orangutan, and myriad forest birds, amphibians, and insects.
- Services: Carbon storage and sequestration, climate regulation, flood moderation, timber and non-timber products, pollination support, and cultural values.
- Notes: Tropical forests hold exceptional biodiversity and carbon. Temperate forests offer critical breeding habitat for migratory birds. Intact forest cores support area‑sensitive species; fragmentation erodes these values.
Wetlands (including peatlands, marshes, mangroves)
- Key species: Waterfowl, amphibians, crocodilians, otters, salmonids, and countless invertebrates; mangroves shelter juvenile reef fish.
- Services: Water filtration, flood control, groundwater recharge, carbon storage (especially peatlands), fisheries nurseries, storm protection. Peatlands cover ~3% of land yet store about 30% of global soil carbon (UNEP).
Grasslands and savannas
- Key species: Bison, pronghorn, African elephants and antelopes, grassland birds (larks, pipits), pollinators.
- Services: Soil carbon storage, forage production, erosion control, pollination, groundwater recharge. Temperate grasslands are among the most converted and least protected biomes (WWF).
Deserts and drylands
- Key species: Fennec fox, addax, desert tortoise, kangaroo rat, reptiles, drought-adapted shrubs and succulents.
- Services: Grazing livelihoods, mineral resources, dust and albedo regulation, unique genetic adaptations to heat and drought. Drylands support over 2 billion people and are highly climate‑sensitive (UNCCD).
Marine and coastal (reefs, seagrass, kelp, open ocean)
- Key species: Coral reef fishes, sharks, sea turtles, marine mammals, seabirds, invertebrates, phytoplankton.
- Services: Protein for billions, coastal protection, oxygen production, carbon sequestration (blue carbon). Coral reefs support about 25% of marine species and buffer storms for an estimated 500 million people (UNEP/NOAA). For deeper detail, see our Ocean Conservation guide: /conservation/ocean-conservation-protecting-marine-biodiversity
Urban green spaces
- Key species: Urban‑tolerant birds and bats, foxes, pollinators, amphibians in stormwater features, native plants.
- Services: Heat mitigation, air filtration, stormwater management, recreation, and stepping‑stone habitat that improves landscape connectivity. With 56% of people living in cities (UN DESA), urban habitats matter for both biodiversity and public health.
Primary threats to habitats
IPBES identifies changes in land and sea use as the leading driver of biodiversity loss, followed by exploitation, climate change, pollution, and invasive alien species. How these pressures play out varies by region and habitat.
Habitat loss and fragmentation
- Agriculture and forestry: Expansion and intensification convert forests, grasslands, and wetlands. In the Brazilian Cerrado, soy and cattle drive native savanna loss; in Southeast Asia, oil palm has replaced peat swamp forests.
- Infrastructure: Roads, pipelines, canals, and railways dissect landscapes. A 2015 Science analysis found 70% of the world’s remaining forests lie within 1 km of an edge, where hotter, drier conditions and predators penetrate.
- Urban sprawl: Low‑density development often removes or isolates remaining habitat patches and riparian corridors.
Fragmentation increases edge effects, reduces core habitat, and disrupts animal movement and gene flow. It also concentrates wildlife near hazards like roads and fences.
Invasive alien species
IPBES (2023) reports more than 37,000 alien species established worldwide, around 3,500 of which have documented harmful impacts. The estimated global economic cost exceeds $423 billion per year and is rising. Island ecosystems are particularly vulnerable, with invasive mammals driving many bird extinctions.
Pollution
- Nutrient runoff from farms and wastewater creates coastal hypoxic “dead zones” (400+ worldwide) that smother marine life.
- Plastics: An estimated 11 million metric tons of plastic enter the ocean annually and could triple by 2040 without action (Pew 2020).
- Toxics: Pesticides, mercury, and PFAS accumulate in food webs and reduce reproductive success in top predators and pollinators.
Climate change
Warming, shifting precipitation, sea‑level rise, and more frequent extremes are reshaping habitats. Coral bleaching events are intensifying; wildfire seasons are lengthening in many regions; alpine and polar species are losing climatic space. Climate change amplifies other stressors, from disease to invasive spread.
How renewable energy and infrastructure development affect habitats
Clean energy is essential to stabilize climate, but siting and design matter for habitats:
- Land footprint: Utility‑scale solar typically uses about 3–10 acres per MW of capacity (NREL). Wind projects space turbines widely (tens of acres per MW), but direct disturbed area is usually a few percent of the footprint.
- Wildlife interactions: Poorly sited wind farms can increase bird and bat mortality; solar in intact deserts can fragment shrubland habitat; hydropower dams block fish migrations; transmission lines and roads create new edges and collision risks.
- Solutions: Strategic siting on previously disturbed lands (brownfields, rooftops, canals), wildlife‑aware turbine operations (raising cut‑in speeds and smart curtailment can reduce bat fatalities by 50–70% in many studies), bird‑safe transmission designs, and fish passages or dam removals. For a deeper dive on maximizing climate and biodiversity wins, see: /conservation/balancing-scales-renewable-energy-impacts-conservation-maximize-benefits
Regional examples
- North America: Great Plains grasslands continue to be converted to row crops; desert solar in the U.S. Southwest must avoid high‑value desert tortoise and kit fox habitat.
- Europe: Onshore wind siting in raptor flyways requires avoidance buffers and turbine‑by‑turbine curtailment.
- Africa: New transport and energy corridors can bisect savannas and wetlands if not planned with connectivity in mind.
- Southeast Asia: Hydropower cascades in the Mekong have altered sediment and fish migrations, affecting food security and river dolphins.
Conservation approaches and policies that work
Protected and conserved areas
- Coverage: About 17% of land and 8% of the ocean are in protected areas globally (UNEP‑WCMC, 2023), with additional “Other Effective Area-Based Conservation Measures” (OECMs) growing.
- Quality matters: Effectiveness depends on design (covering Key Biodiversity Areas), connectivity, funding, and enforcement. The Kunming–Montreal Global Biodiversity Framework targets conserving 30% of land and sea by 2030 (“30x30”).
Habitat restoration
- Forest and mangrove restoration can rebuild carbon stocks and wildlife habitat; mangroves reduce annual flood damages by roughly $65 billion globally (Beck et al.).
- Peatland rewetting halts massive carbon losses and restores breeding habitat for wetland birds.
- Rewilding: Letting natural processes return—predator recovery, natural river dynamics—can accelerate ecosystem function. See our explainer on rewilding: /conservation/what-is-rewilding-ecosystem-restoration-conservation
Connectivity: corridors and permeable landscapes
Wildlife corridors, stepping‑stones, and permeable fences maintain movement and gene flow.
- Examples: Yellowstone‑to‑Yukon connects 3,200 km of habitat across North America; Florida’s Wildlife Corridor initiative aims to conserve about 18 million acres linking Everglades to Panhandle.
- Tools: Conservation easements and road‑crossing structures (overpasses, underpasses) measurably reduce wildlife‑vehicle collisions and reconnect populations.
Sustainable land and sea use
- Standards and incentives: Certification (FSC for forests, RSPO for palm oil), zero‑deforestation commitments, and fisheries co‑management can reduce habitat pressures.
- Payments for Ecosystem Services (PES): Costa Rica’s program helped forest cover rebound from ~26% in the 1980s to over 50% by the 2010s, while supporting local livelihoods (government and academic evaluations).
- Indigenous and community stewardship: IPBES reports that lands managed by Indigenous peoples often have equal or better conservation outcomes than formal protected areas when rights are secure and supported.
For on‑the‑ground practice and policy design, see our field‑tested strategies: /sustainability-policy/effective-wildlife-conservation-practices-guide
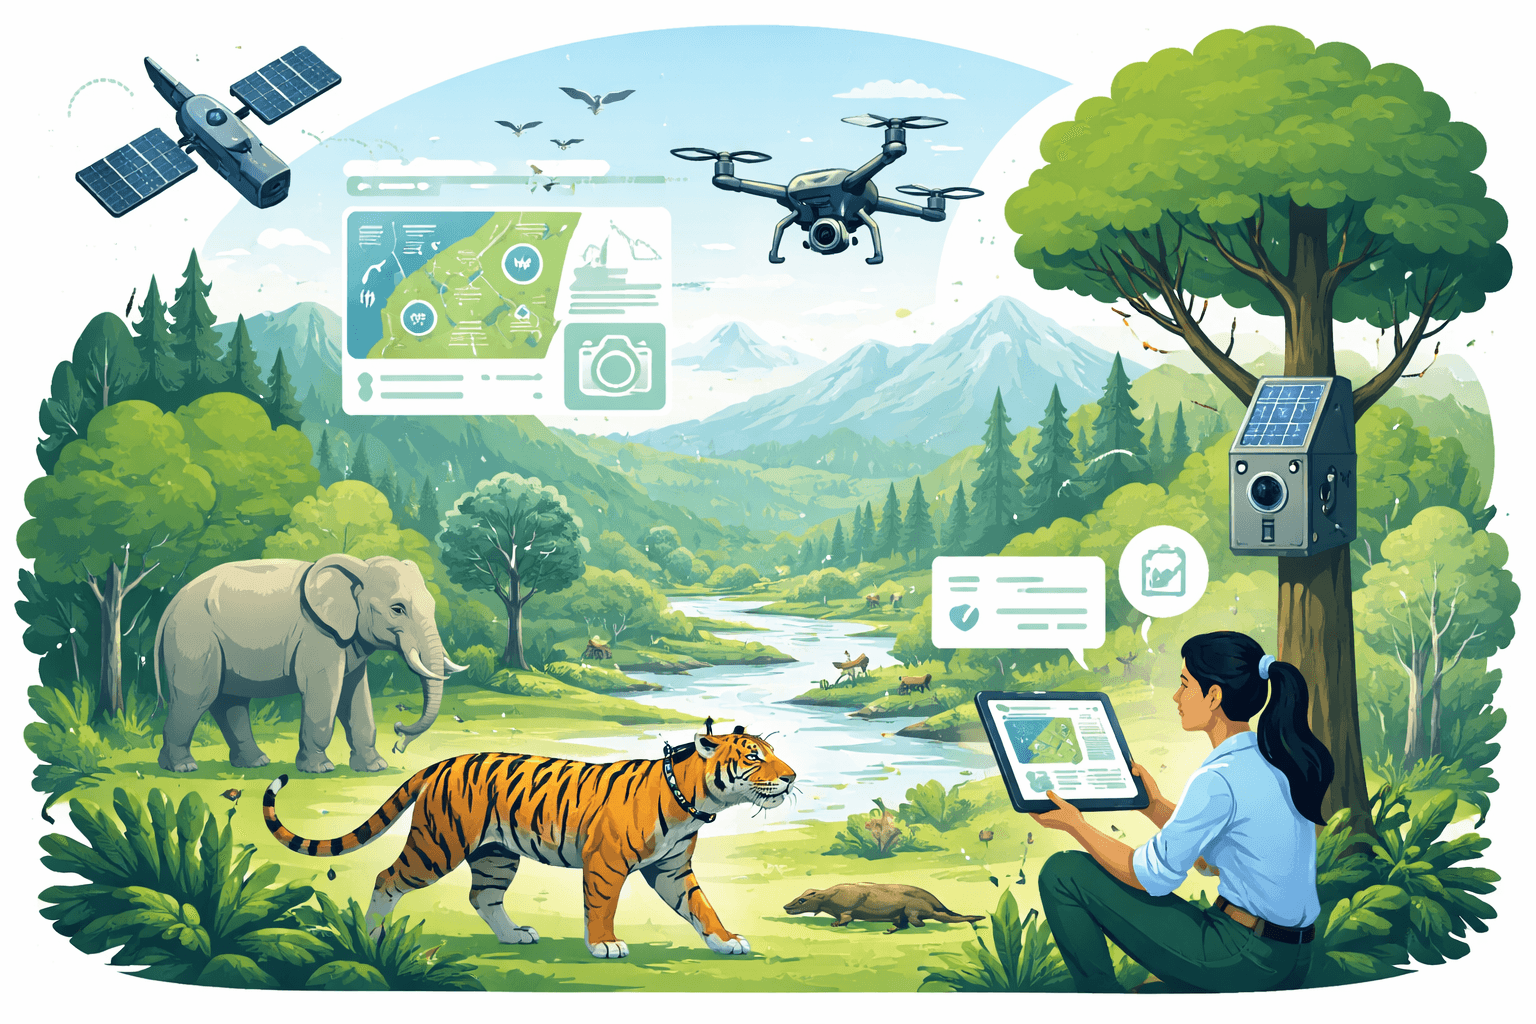
The role of science and technology in protecting habitats
Modern conservation is data‑driven. New tools measure trends, target priority areas, and track outcomes.
Remote sensing and GIS
- Satellites: Landsat, Sentinel, and commercial constellations map land cover, forest loss, fires, and coastal change at weekly to daily cadence. NASA’s GEDI space lidar maps canopy height and structure, improving biomass and habitat models.
- SAR radar can see through clouds to monitor tropical deforestation and peatland drainage. Global Forest Watch uses these data to deliver near‑real‑time forest alerts that enable faster enforcement.
- Corridor modeling: GIS tools like Circuitscape model animal movement and identify pinch points to prioritize land protection and road crossings.
Drones, acoustic sensors, and camera traps
- Drones rapidly map restoration sites, wetlands, and mangroves with centimeter‑level detail.
- Acoustic monitoring tracks elusive birds, bats, and frogs over large areas; AI classifiers now sort millions of calls to species.
- Camera trap networks estimate occupancy (the chance a species uses a site) and activity patterns, supporting before‑after, control‑impact (BACI) evaluations of protected areas and corridors.

Bushnell Core DS-4K No Glow Trail Camera. Hunting ...
View on AmazonEnvironmental DNA (eDNA)
Organisms shed DNA into water, soil, and air. eDNA sampling can detect rare or invasive species with high sensitivity and lower field effort. Standardized protocols and reference libraries are improving comparability across regions.
Citizen science
- Platforms such as eBird and iNaturalist have generated hundreds of millions of records—over a billion bird observations in eBird alone—powering species distribution models, migration forecasts, and urban biodiversity plans.
Artificial intelligence increasingly stitches these data together to predict hotspots, detect illegal activity, and guide enforcement. For applications and pitfalls, see: /sustainability-policy/how-ai-is-used-in-conservation-technologies-applications-challenges
Measuring success
Effective programs define clear metrics, collect baseline data, and monitor change:
- Habitat metrics: Area protected/restored, core vs. edge ratio, canopy height, wetland hydroperiod, stream temperature.
- Species metrics: Occupancy, abundance/biomass, reproductive success, genetic diversity.
- Pressure metrics: Road density, human footprint indices, grazing intensity, invasive species presence.
- Outcome metrics: Water quality (nutrients, turbidity), flood damages avoided, carbon stored/avoided emissions, wildlife‑vehicle collisions reduced.
By the numbers
- 1 million: Species estimated at risk of extinction (IPBES).
- 31%: Global land area covered by forests (FAO 2020).
- ~35%: Decline in natural wetlands since 1970 (Ramsar 2018).
- ~17% land, ~8% ocean: Global protected area coverage (UNEP‑WCMC 2023).
- $423 billion/yr: Estimated global cost of invasive species (IPBES 2023).
- 3–10 acres/MW: Typical utility‑scale solar land use (NREL).
- 50–70%: Typical reduction in bat fatalities from higher wind turbine cut‑in speeds and smart curtailment (DOE/NREL studies).
- ~30%: Share of global soil carbon stored in peatlands that cover ~3% of land (UNEP).
- 25%: Share of marine species associated with coral reefs; ~500 million people benefit from reef protection (UNEP/NOAA).
- 56%: Share of people living in cities today (UN DESA), underscoring the role of urban nature.
Practical, scalable actions for readers and stakeholders
Site‑level best practices
- Habitat‑friendly gardening: Replace lawn with native plants, layered structure (trees, shrubs, flowers), and continuous bloom for pollinators. Research shows yards with >70% native plant biomass support successful breeding by insectivorous birds like chickadees (Narango et al., Biological Conservation). Minimize pesticides and keep domestic cats indoors to protect birds and small mammals. Start here: /sustainability-policy/wildlife-friendly-gardening-tips
- Water and soil: Install rain gardens and vegetated swales; leave leaf litter as invertebrate habitat; reduce irrigation through drought‑tolerant natives.
- Light and glass: Use warm, shielded, motion‑sensing lights; apply bird‑safe window markers with 2x4 inch spacing to cut collisions dramatically.
- Buffers and riparian zones: Maintain or restore 15–30 m native vegetation buffers along streams and shorelines; these can reduce nutrient runoff by 40–80% and cool water for fish.
- Fencing and crossings: Use wildlife‑permeable fencing (e.g., smooth top wires, wildlife gates) and advocate for road crossings at known migration bottlenecks.

Feather Friendly® Bird Collision Deterrent Markers (Small-scale DIY, 3 Black Rolls) : Patio, Lawn & Garden
View on AmazonFor landowners, businesses, and developers
- Avoid‑minimize‑offset hierarchy: First avoid high‑value habitat; then minimize impacts; finally, offset residual impacts with measurable, additional, and durable habitat gains.
- Site screening: Use biodiversity layers (Key Biodiversity Areas, Important Bird and Biodiversity Areas) and species occurrence data to guide siting. Prioritize brownfields, rooftops, parking canopies, and already degraded lands for solar.
- Renewable operations: Implement curtailment protocols during high‑risk bat periods; install detection systems and deterrents; design transmission with bird flight diverters and insulated risk points.
- Working lands: Adopt regenerative grazing and agroforestry; retain field margins and flower strips; time mowing/harvests to avoid nesting seasons.
For policymakers and funders
- Deliver on 30x30 with quality: Protect climate‑resilient cores and climate refugia; fund management and local stewardship, not just paper parks.
- Invest in connectivity: Prioritize corridor acquisitions, easements, and road‑crossings where modeling and collision data align.
- Scale restoration: Incentivize mangroves, peatland rewetting, and native grasslands through PES, tax credits, and carbon markets with strong safeguards.
- Mainstream biodiversity: Embed no‑net‑loss or net‑gain policies in planning and procurement; require biodiversity data and monitoring in permits.
- Support community rights: Recognize Indigenous land tenure and co‑management; fund community rangers and local monitoring.
How to support effective organizations and policy
- Focus on outcomes: Fund groups that publish transparent metrics—hectares protected/restored, species trends, water quality improvements, avoided emissions.
- Leverage citizen science: Join bioblitzes, contribute to eBird/iNaturalist, and support local land trusts.
- Engage on siting: Advocate for wildlife‑smart renewable energy and transmission planning in local and regional processes. See our analysis of win‑win strategies: /conservation/balancing-scales-renewable-energy-impacts-conservation-maximize-benefits
- Everyday choices: Reduce meat from deforestation‑linked supply chains, choose certified products, and support municipal green infrastructure. For broader home sustainability actions, see: /conservation/how-to-practice-conservation-at-home-practical-steps-save-energy-water-waste-wildlife
Case studies with measurable outcomes
- Penobscot River, Maine (USA): A basin‑scale restoration that removed or bypassed dams reopened nearly 2,000 km of habitat. Alewife runs surged from a few thousand to over 2 million within years of project completion, supporting eagles, bears, and coastal fisheries (project monitoring reports).
- Costa Rica PES: National payments for ecosystem services helped drive forest cover from ~26% (1980s) to >50% (2010s) while boosting rural incomes; satellite data confirm reduced deforestation rates compared to comparable areas (FAO and academic studies).
- No‑take marine reserves: Global meta‑analyses show fish biomass is, on average, 2–5 times higher in fully protected no‑take areas than in fished areas, with spillover benefits to adjacent fisheries over time (PNAS/Nature studies).
- Road crossings: Wildlife overpasses and underpasses on U.S. Highway 93 in Montana and Canada’s Banff National Park cut wildlife‑vehicle collisions by 80–90% and restored genetic exchange in grizzly bears and other species (transport agency and academic evaluations).
Where wildlife habitats and conservation are heading
- From area counts to quality and function: The 30x30 push is shifting from paper targets to protecting climate‑resilient cores, intactness, and ecological function—paired with connectivity.
- Restoration at scale: The UN Decade on Ecosystem Restoration (2021–2030) is mobilizing finance and standards to ensure projects deliver durable biodiversity, climate, and community benefits, not just tree counts.
- Data‑driven, adaptive management: Near‑real‑time habitat alerts, AI‑assisted monitoring, and standardized biodiversity metrics are enabling faster course corrections and accountability.
- Integrating climate and nature: Nature‑based solutions (mangroves, peatlands, grassland protection) deliver high climate value per dollar while safeguarding species—if implemented with strong safeguards and local consent.
- Wildlife‑smart infrastructure: Renewable energy and transmission expansion will proceed; the opportunity is to mainstream avoidance and mitigation so clean energy buildout also yields net habitat gains.
Wildlife habitats and conservation succeed when we protect intact cores, reconnect landscapes, restore degraded systems, align incentives for stewards, and hold ourselves accountable to measurable results. The tools exist; the urgency is clear. With thoughtful planning and technology, protecting habitats can advance biodiversity, climate goals, and resilient communities together.
Recommended Products
Conservation Planning: Informed Decisions for a Healthier Planet
“In Conservation Planning: Informed Decisions for a Healthier Planet, Craig Groves and Ed Game have produced <strong>a well organized, easy to read account of pragmatic approaches to safeguarding crea
Bushnell Core DS-4K No Glow Trail Camera. Hunting ...
Browse Bushnell trail cameras with crystal-clear image quality and weather-resistant design. Perfect for scouting and property monitoring.
Feather Friendly® Bird Collision Deterrent Markers (Small-scale DIY, 3 Black Rolls) : Patio, Lawn & Garden
Feather Friendly is a simple solution ... conservation efforts. <strong>DIY roll(s) in colour of choice (Light Grey or Black) come with 2 paper measuring tapes, an application squeegee and installatio
More in Sustainability Policy
- Wildlife Conservation Methods: Practical Approaches, Tech Tools, and How to Measure Success
- Why Wildlife Conservation Matters: Ecosystems, People, and Practical Solutions
- Effective Wildlife Conservation Practices: Practical Strategies, Monitoring, and Community-Led Solutions
- How to Protect Endangered Species: Practical Actions, Policy & Technology