Recycling Programs in Schools: A Practical Guide to Starting, Funding, and Measuring Success
Why recycling programs in schools matter now
K–12 cafeterias served roughly 4.9 billion lunches in the U.S. in 2022 (USDA), generating large volumes of packaging and food scraps. Studies of the National School Lunch Program consistently find that 20–40% of food served is discarded (USDA; GAO). At the same time, U.S. municipal recycling and composting hovered around 32% in recent years (U.S. EPA, 2021), with contamination in recycling streams averaging about 17% (The Recycling Partnership, 2022). Well-designed recycling programs in schools can dramatically cut waste, costs, and emissions while teaching lifelong sustainability habits.
Garbology: Our Dirty Love Affair with Trash
But our bins are just the starting point for a strange, impressive, mysterious, and costly journey that may also represent the greatest untapped opportunity of the century. In Garbology, Edward Humes
Check Price on AmazonThis guide details how to plan, launch, fund, and evaluate recycling programs in schools — from materials and models to stakeholder engagement, data tracking, and long-term improvement.
Core goals and benefits of school recycling programs
Environmental impact aligned with district sustainability objectives
- Emissions reduction: Recycling 1 ton of mixed paper avoids roughly 3 metric tons of CO2e compared with landfilling (EPA WARM model). Making aluminum cans from recycled content uses about 95% less energy than virgin production (EPA; Aluminum Association).
- Landfill diversion: Adding paper/cardboard recycling and cafeteria organics often diverts 40–70% of a school’s waste by weight, based on state and district case studies (CalRecycle; state DEP reports). Diversion supports district climate action plans, zero-waste goals, and state solid waste targets.
- Resource conservation: Recovering paper, cardboard, and metals lowers demand for timber and mining inputs; composting returns nutrients and carbon to soils.
Financial benefits
- Right-sizing trash service: Schools commonly reduce dumpster size or pickup frequency once recycling/composting starts, lowering hauling fees (EPA School Waste Reduction guidance; CalRecycle case studies). Even a single avoided weekly pickup can save thousands of dollars annually depending on local rates.
- Avoided contamination fees: Cleaner streams reduce contamination surcharges and rejected loads.
- Grant leverage: Programs can unlock state or municipal grants and in-kind support for carts, signs, and organics collection.
Education and behavior change
- Hands-on learning: Recycling programs in schools turn sustainability into a visible, daily practice that reinforces science, civics, and environmental literacy standards.
- Student leadership: Green Teams develop project management, data analysis, and peer-education skills.
- Community spillover: Students model sorting behaviors at home, improving local recycling quality.
What to collect: materials and program models
Design your program around actual waste streams, local processing capacity, and clear, consistent rules. Start with one or two materials, then phase in more as systems mature.
Common materials in schools
- Paper and cardboard: Classroom paper, office paper, homework sheets, cardboard shipping boxes. Keep clean and dry.
- Plastics: Focus on clearly recyclable items accepted by your MRF (materials recovery facility), often bottles and jugs. Lightweight food packaging may or may not be accepted locally.
- Metals and glass: Beverage cans are widely recyclable; glass acceptance varies by market.
- Organics (composting): Cafeteria food scraps, soiled paper (napkins), and sometimes compostable serviceware if your composter accepts it.
- E-waste: Broken Chromebooks, cables, keyboards, and other devices require certified handlers; do not place in regular recycling.
Program models and logistics
Classroom and office recycling (paper-first model)
- Infrastructure: Blue bins in every classroom/office; centralized copy-room carts; custodial dollies for paper collection.
- Logistics: Pair each blue bin with a small landfill bin to encourage sorting; schedule weekly paper pickup.
- Training: Short teacher briefings; student paper monitors.
Cafeteria sorting stations (organics + containers)
- Infrastructure: Three-bin stations — green (organics), blue (recyclables), black/gray (landfill), plus a “liquids” pour-off bucket to prevent soggy recyclables.
- Logistics: Trained student or staff “station coaches” during lunch; color-coded signs with photos of actual items.
- Procurement alignment: Choose food packaging that matches local acceptance (e.g., aluminum cans over mixed-material pouches; compostable items only if your composter accepts them).
Outdoor/athletics recycling
- Infrastructure: Weatherproof paired bins near fields and playgrounds; lids with can/bottle openings to cut contamination.
- Logistics: Collection after events; signage in team areas.
E-waste collection
- Infrastructure: Locked collection box in the office/IT department; periodic community e-waste drives with a certified vendor (R2 or e‑Stewards).
- Logistics: Chain-of-custody for data-bearing devices; vendor certificates of recycling.
- Resource: For safe, responsible e‑waste handling, see How to Recycle Electronics: A Practical Guide to Safe, Responsible E‑Waste Disposal (/sustainability-policy/how-to-recycle-electronics-practical-guide-safe-responsible-e-waste-disposal).
Special events and drives
- One-day cardboard roundups after textbook deliveries; bottle and can return drives in deposit states; spring clean‑outs.
Implementation: stakeholders, audits, operations, and partnerships
Step 1: Conduct a simple waste audit
A waste audit reveals priorities, contamination risks, and bin needs.
- Scope: Choose a representative day (avoid holidays/test weeks). Capture cafeteria, classrooms, and office areas.
- Materials: Gloves, tarps, bathroom scale or hanging scale, labeled bags/containers, tally sheets.
- Method:
- Collect separate bags from landfill, recycling, and organics (if any) by location.
- Weigh each bag; record weight and location.
- Sort a sample (e.g., 25–50%) to identify what’s in the wrong bin; estimate contamination % and missed recyclables.
- Outputs: Baseline totals by stream, contamination rates, top five items by weight/volume. Translate into plain-language goals (e.g., “Divert 300 lbs/week of food scraps; cut recycling contamination from 20% to 10%”).
For more step-by-step ideas tailored to schools, see Practical Recycling Program Ideas for Schools: Starter Concepts, Logistics, and Long-Term Success (/sustainability-policy/recycling-program-ideas-for-schools-starter-concepts-logistics-long-term-success).
Step 2: Secure buy‑in and define roles
- Administrators: Approve goals, policy (e.g., campus-wide bin standards), schedule time for staff training, and align with district plans.
- Custodial/operations: Co-design bin placement, liner colors, and routes; sanity-check collection frequencies and storage space.
- Food service: Align menus and packaging; set up share tables where allowed by health codes to reduce waste.
- Teachers: Integrate brief sorting reminders; appoint classroom monitors.
- Students: Form a Green Team to help with peer education, audits, and data tracking.
- Parents/PTA: Support fundraisers, volunteer at sorting stations, and promote consistency at home.
A simple RACI chart (Responsible, Accountable, Consulted, Informed) for each task prevents gaps.
Step 3: Design the system for simplicity
- Standardize colors: Blue = recycling; Green = organics; Black/gray = landfill. Use the same across classrooms, cafeteria, and offices (EPA/Recycle Across America color norms).
- Co‑locate bins: Always place recycling and landfill together — never a lone recycling bin inviting contamination.
- Right-size bins: Larger organics carts in cafeterias; smaller desk-side landfill bins to “nudge” sorting.
- Lids and labels: Restrictive lids (can-shaped holes) reduce contamination; post photo-based signage of actual items used on campus.
- Collection plan: Map routes and storage; coordinate with haulers/composters on pickup days and acceptable materials.
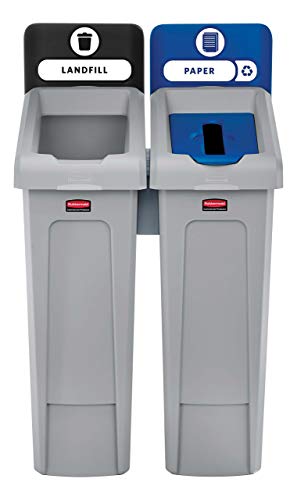
Rubbermaid Commercial Products 2007916 Slim Jim Recycling Station, 2 Stream Landfill/Bottles Cans: Amazon.com: Industrial & Scientific
View on AmazonStep 4: Train and engage
- Short, repeated trainings: 10–15 minute refreshers for staff and students at semester start and after breaks.
- Student station coaches: Assign rotating volunteers during lunch for the first 4–6 weeks or after system changes.
- Visual cues: Projector slide in morning announcements; posters at eye level; stickers on bins.
- Curriculum tie-ins: Math (weighing and graphing), science (decomposition, carbon cycle), civics (local policy and infrastructure).
Step 5: Partner with vendors and your city
- Hauler/MRF: Confirm accepted materials, contamination thresholds, cart sizes, and reporting options. Ask for contamination feedback and education materials.
- Composter/organics processor: Verify what serviceware is accepted; arrange for liners; set moisture/cleanliness expectations.
- Municipality/public works: In many regions, the city or county offers free carts, staff trainings, or mini‑grants. If you plan broader community collaboration, see How to Set Up a Local Recycling Initiative (/sustainability-policy/how-to-set-up-a-local-recycling-initiative).
- Electronics recyclers: Use R2 or e‑Stewards certified firms for periodic drives and device retirement.
By the numbers
- 20–40%: Typical range of cafeteria food wasted in school lunch programs (USDA; GAO analyses).
- ~32%: Recent U.S. recycling and composting rate (U.S. EPA, 2021).
- ~17%: Average contamination in U.S. recycling streams (The Recycling Partnership, 2022).
- ~3 MTCO2e: Emissions avoided by recycling 1 ton of mixed paper (EPA WARM).
- 95%: Energy savings when producing aluminum from recycled vs. virgin material (EPA/Aluminum Association).
- 62 million metric tons: Global e‑waste generated in 2022, only ~22% documented as properly recycled (UN Global E‑waste Monitor, 2024) — a reason to manage school electronics responsibly.
Preventing contamination and maximizing recovery
If your recycling is “dirty,” your diversion rate and savings will suffer.
- Keep liquids out: A simple liquids bucket at cafeteria sorting cuts soggy recyclables and liner weight.
- Make it obvious: Use real-item photos on signs; avoid jargon. If only bottles and cans are accepted, state exactly that.
- Incentivize accuracy: Classroom competitions on contamination reduction; monthly shout‑outs for cleanest streams.
- Audit and feedback: Spot-check bins weekly for the first two months; share quick wins and recurring errors.
For tips on reducing contamination, labeling, and what to do with hard-to-recycle items, see How to Recycle Waste Effectively: Practical Guidance to Reduce Contamination and Maximize Recovery (/sustainability-policy/how-to-recycle-waste-effectively-practical-guidance).
Monitoring, metrics, and reporting
Build measurement into operations from day one. Keep it simple, visual, and routine.
Core metrics
- Diversion rate: (Recycling + Organics) ÷ (Recycling + Organics + Landfill). Track monthly and annually.
- Contamination rate: Percent of wrong material found in a given stream (e.g., trash in recycling).
- Capture rate by material: Share of target material (e.g., paper) that reaches the right stream vs. total generated.
- Cost per student: Total net waste cost ÷ enrollment (helps compare schools of different sizes).
- Service efficiency: Dumpster size × pickups per week per stream (right‑sizing indicator).
- Emissions avoided: Use EPA WARM factors to estimate MTCO2e saved by material type.
Data collection methods
- Weigh carts: Bathroom or platform scales for a weekly weighing routine (e.g., weigh 1 in 4 carts and extrapolate).
- Hauler reports: Request monthly tonnage or volume by stream and contamination notes.
- Student data teams: Assign Green Teams to graph diversion and contamination trends.
- Visual audits: Photolog recurring problem items to target communications.

Etekcity Scale for Body Weight, Bathroom Digital Weighing Machine, Extra Wide Platform, High Capacity, Accurate and Safe, Large Backlit LCD Display, 440 lb, Tempered Glass : Industrial & Scientific
View on AmazonReporting cadence and audiences
- Monthly: Custodial and admin review; adjust service levels and signage.
- Quarterly: Share highlights with staff, PTA, and students; celebrate milestones.
- Annually: District sustainability report — include diversion, contamination, net cost/savings, and GHG reductions.
Cost-benefit example (illustrative)
Assume a 1,000‑student school pays $240 per landfill dumpster pickup. Pre‑program: two 6‑yard dumpsters, 5 pickups/week total = $1,200/week. After launching paper recycling and cafeteria organics, the school reduces landfill pickups to 3/week and adds 2 organics pickups at $160 each:
- New weekly cost: (3 × $240) + (2 × $160) = $1,040/week
- Weekly savings: $160; Annual (36 weeks): ~$5,760
This excludes grants and avoided contamination fees. Actual rates vary — confirm local pricing and adjust service levels to match measured volumes.
Common challenges and proven solutions
Contamination in recycling and organics
- Solution: Co‑locate bins; use restrictive lids; post real‑item photos; station coaches the first month and after breaks; align packaging with local acceptance.
Inconsistent participation across classrooms
- Solution: Standardize bin sets and labels; assign student monitors; add five‑minute refresher before winter/spring terms.
Space constraints for carts and docks
- Solution: Use slim-profile indoor bins; switch to fewer, larger outdoor dumpsters; stagger pickup days; compact cardboard to reduce volume.
Liquids and food residue
- Solution: Add a “liquid dump” step; provide squeegee and tray-scrape station; train staff to close lids before moving bins in rain.
Staff time for sorting stations
- Solution: Time-bound support (first 4–6 weeks); recruit parent/PTA volunteers; rotate student Green Teams by grade.
E-waste management and data security
- Solution: Restrict collection to a locked site; partner with certified recyclers; obtain certificates of recycling and data destruction.
Mixed or confusing packaging
- Solution: Prefer aluminum cans and PET bottles over multilayer pouches; adopt district-wide sustainable procurement language tied to local acceptance; only buy “compostable” items if your composter accepts them.
Funding sources and resources
- State and municipal grants: Many state environmental agencies and local solid waste authorities offer mini‑grants for bins, signs, and organics pilots (check your state DEP/DOE). Municipalities may also provide free carts, technical assistance, or staff trainings.
- District budgets and savings reinvestment: Use documented hauling savings to fund signs, scales, and student stipends.
- PTAs and education foundations: Small grants for Green Team supplies, signage, and engagement.
- Corporate and community partners: Local grocers, waste haulers, and service clubs often sponsor bins or student awards.
- Vendor in‑kind support: Ask haulers/composters for educational posters, training, and contamination feedback.
If you plan to partner beyond campus or launch neighborhood events, see How to Set Up a Local Recycling Initiative (/sustainability-policy/how-to-set-up-a-local-recycling-initiative).
Real-world program patterns that scale
- Phase-and-prove: Districts that roll out to a few schools, measure results, and standardize bin sets and signage typically achieve better performance when scaling to all campuses (CalRecycle and city program case studies).
- Organics unlocks big gains: Adding cafeteria organics often doubles diversion compared with recycling alone because food is heavy.
- Standardization beats one-offs: Consistent colors, signs, and bin pairings across buildings reduce training needs and contamination.
- Data drives right‑sizing: Schools that track weights and adjust service levels 2–3 times per year report the largest cost reductions.
- Student leadership sustains change: Green Teams that audit, present data to principals, and lead peer training keep contamination low after initial excitement fades.
A semester-by-semester launch plan
- Weeks 1–2: Baseline audit; secure admin and custodial buy‑in; confirm vendor acceptance lists; order bins/signage.
- Weeks 3–4: Staff training; student Green Team onboarding; finalize bin maps and pickup schedules.
- Weeks 5–6: Launch cafeteria sorting with station coaches; roll out classroom paper recycling; begin weekly weights of representative carts.
- Weeks 7–9: Tweak bin placement; address top contamination items; present early results in morning announcements.
- Weeks 10–12: Right-size service levels with hauler; plan an electronics or cardboard roundup before break.
- Next semester: Add organics to teacher lounges; integrate metrics into science/math units; apply for mini‑grants; consider expanding to athletics and events.
What this means for administrators, educators, and facilities
- Administrators: Put goals and standards in writing; align procurement with local acceptance; require quarterly reporting of diversion and contamination.
- Educators: Weave data from audits into lessons; assign short student leadership roles; celebrate improvements.
- Facilities/custodial: Co‑design practical routes and storage; request hauler feedback on contamination; re‑evaluate service levels by season.
Where recycling programs in schools are heading
Districts are moving toward integrated materials management: standardized bin systems, organics in cafeterias, procurement policies that prioritize recyclable/compostable items verified by local processors, and dashboards that share diversion, costs, and emissions in real time. As more states adopt extended producer responsibility (EPR) for packaging and electronics, schools will see improved take‑back options and clearer labeling. The combination of student leadership, better packaging design, organics infrastructure, and data-driven right-sizing is making zero-waste campuses a practical, budget-conscious goal.
For additional school-focused ideas and implementation checklists, visit Practical Recycling Program Ideas for Schools: Starter Concepts, Logistics, and Long-Term Success (/sustainability-policy/recycling-program-ideas-for-schools-starter-concepts-logistics-long-term-success).
Recommended Products
Garbology: Our Dirty Love Affair with Trash
But our bins are just the starting point for a strange, impressive, mysterious, and costly journey that may also represent the greatest untapped opportunity of the century. In Garbology, Edward Humes
Rubbermaid Commercial Products 2007916 Slim Jim Recycling Station, 2 Stream Landfill/Bottles Cans: Amazon.com: Industrial & Scientific
Sort recyclables with ease using the Rubbermaid Commercial Products Slim Jim Recycling Station, 2-Stream. This recycling solution features a modular, easy-to-assemble design that can be adapted to sui
Etekcity Scale for Body Weight, Bathroom Digital Weighing Machine, Extra Wide Platform, High Capacity, Accurate and Safe, Large Backlit LCD Display, 440 lb, Tempered Glass : Industrial & Scientific
Buy Etekcity Scale for Body Weight, Bathroom Digital Weighing Machine, Extra Wide Platform, High Capacity, Accurate and Safe, Large Backlit LCD Display, 440 lb, Tempered Glass on Amazon.com ✓ FREE SHI
More in Sustainability Policy
- Practical Recycling Program Ideas for Schools: Starter Concepts, Logistics, and Long-Term Success
- How to Recycle Effectively: Practical Guidance to Reduce Waste and Avoid Contamination
- How to Set Up a Local Recycling Initiative: Practical Steps to Start, Run, and Sustain Community Recycling
- Practical Tips for Organizing a Successful Community Recycling Drive