Using Technology for Environmental Protection: Tools, Impacts, and Practical Guidance
Environmental protection is undergoing a data revolution. Satellites now revisit any point on Earth daily, low‑cost sensors blanket cities with hyperlocal air data, and AI turns raw signals into actionable insights. The opportunity is clear: using technology for environmental protection can move interventions from reactive to predictive, lower monitoring costs by orders of magnitude, and verify outcomes with rigor. In 2023, Brazil cut Amazon deforestation by 22% year‑over‑year, aided by real‑time satellite alerts from its INPE DETER system; Indonesia has sustained a roughly 64% reduction in primary forest loss from its 2016 peak through enhanced monitoring and enforcement (INPE; World Resources Institute/Global Forest Watch). Methane‑tracking satellites are already pinpointing super‑emitters, supporting policies the IEA estimates could cut oil‑and‑gas methane emissions by 75% with technologies largely available today.
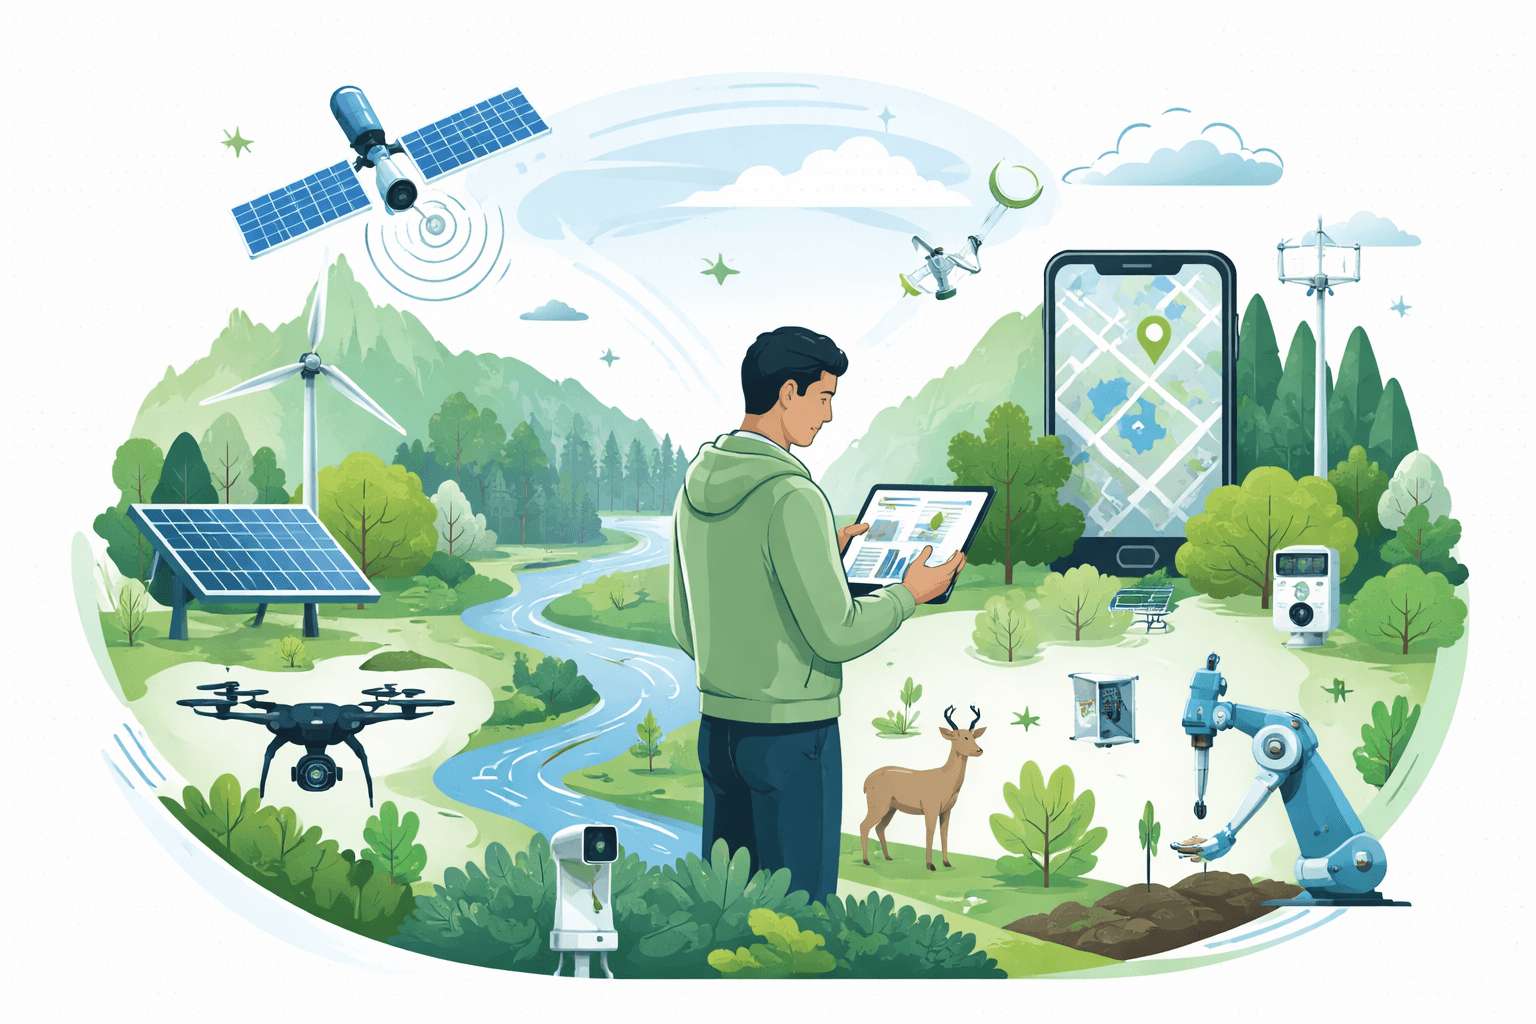
Using technology for environmental protection: the toolkit
Technology helps prevent, detect, and mitigate environmental harm by shrinking the time from impact to action, expanding coverage, and improving attribution. Here’s how the core components fit together.
Remote Sensing and GIS for Ecologists: Using Open Source Software (Data in the Wild)
Amazon.com: Remote Sensing and GIS for Ecologists: Using Open Source Software (Data in the Wild): 9781784270223: Wegmann, Martin, Leutner, Benjamin, Dech, Stefan: Books
Check Price on AmazonEarth observation: satellites and airborne remote sensing
- What it is: Optical and radar satellites (e.g., NASA Landsat, ESA Sentinel) and airborne lidar/imagery providing repeated, georeferenced views of land, water, and atmosphere.
- Strengths: Scalable coverage; historical archives; consistent methods. Sentinel‑2 offers 10 m resolution every ~5 days; Sentinel‑1 radar penetrates clouds for flood and forest monitoring; Planet’s constellations provide near‑daily 3–5 m imagery. NASA’s GEDI lidar profiles forest structure and biomass.
- Uses: Deforestation alerts, crop vigor, flood extents, wildfire severity, coastal change, methane plumes (e.g., GHGSat, MethaneSAT), and illegal mining detection.
Drones and crewed aircraft
- What it is: Uncrewed aerial vehicles (UAVs) and planes with RGB, multispectral, thermal, or lidar payloads.
- Strengths: High‑resolution, taskable, and low‑altitude flexibility; ideal when satellites are too coarse or cloud‑obstructed.
- Uses: Mapping invasive species, counting wildlife, detecting illegal logging, assessing reef damage, and post‑disaster building assessments. Seed‑sowing drones can accelerate restoration; vendors report tens of thousands of seeds/day with lower labor costs, though survival rates hinge on species and site prep.
In‑situ IoT sensors and networks
- What it is: Low‑power devices measuring air pollutants (PM2.5, NO2), water quality (pH, turbidity), soil moisture, noise, or biodiversity via acoustics; connected via LoRaWAN, cellular, satellite IoT, or mesh.
- Strengths: Continuous, local measurements; early warnings; complements remote sensing.
- Uses: Leak detection in water systems, stormwater overflow alerts, industrial emissions oversight (CEMS), and wildlife presence via bioacoustics.
AI and machine learning
- What it is: Models for image classification, anomaly detection, time‑series forecasting, and sensor fusion.
- Strengths: Automates detection (e.g., logging roads in imagery), predicts risks (e.g., fire spread), and triages enforcement (e.g., poaching hotspots). Edge AI runs models on devices for faster, private, and bandwidth‑lean decisions.
- Uses: Species identification from camera traps, methane plume quantification, illegal fishing detection from vessel tracks, and hyperlocal air‑quality inference from sparse sensors.
For deeper examples of AI’s roles, see How AI Is Used in Conservation: Technologies, Real‑World Uses, and Key Challenges (/sustainability-policy/how-ai-is-used-in-conservation-technologies-applications-challenges).
Digital traceability and blockchain
- What it is: Immutable ledgers and interoperable databases linking commodities (e.g., palm oil, cocoa, beef, fish) to origin via geolocation, vessel IDs, or farm polygons.
- Strengths: Supply‑chain transparency, auditability, and compliance reporting (e.g., EU Deforestation Regulation geo‑traceability).
- Uses: Verifying deforestation‑free sourcing, flagging illegal fishing through AIS gaps and port records (Global Fishing Watch tracks 70,000+ industrial vessels), and enabling results‑based finance.
Renewable energy and storage as enablers
- What it is: On‑site solar, microgrids, and batteries powering remote sensors, ranger outposts, desal systems, and disaster communications.
- Strengths: Cuts diesel reliance, lowers OPEX, and improves resilience. In 2023, the world added a record ~510 GW of renewables—about 50% growth year‑over‑year—expanding clean, off‑grid options (IEA Renewable Energy Market Update, 2024).
- Uses: Solar‑powered camera traps, freezer chains for eDNA samples, island microgrids, and grid‑scale decarbonization that reduces air and water pollution.
EF ECOFLOW Solar Generator DELTA 2 with 220W Solar Panel, 1024Wh LFP(LiFePO4) Battery, 1800W AC/100W USB-C Output, Fast Charging Portable Power Station for Home Backup Power, Camping & RVs : Patio, Lawn & Garden
Clean, Green Charging. With up to 500W of solar panel input, DELTA 2 is a solar generator that can be charged while camping, on an RV trip or off-grid. <strong>Includes a 220W Bifacial solar panel to
Check Price on AmazonFor a broader look at climate tech enabling decarbonization, see Innovations in Climate Tech: Breakthroughs, Barriers, and Paths to Scale (/sustainability-policy/innovations-in-climate-tech-breakthroughs-barriers-paths-to-scale).
Citizen science and mobile platforms
- What it is: Community apps for reporting pollution, wildlife sightings, or habitat damage; participatory mapping; SMS advisories.
- Strengths: Scales human sensing, builds legitimacy, and lowers data costs. With proper validation, it fills critical gaps.
- Uses: Community‑led air monitoring, beach plastic tallies, invasive species reporting, and indigenous land encroachment alerts.
For additional context on how technology is reshaping conservation practice, see How Technology Is Transforming Conservation: Tools, Impacts, and Responsible Deployment (/sustainability-policy/role-of-technology-in-conservation).
Case studies: measurable outcomes and cost/benefit insights
Forest monitoring and enforcement
- Brazil’s real‑time alerts: INPE’s DETER system generates rapid deforestation alerts from satellite imagery, directing enforcement. In 2023, Amazon deforestation fell by roughly 22% versus 2022 as detection and prosecutions increased (INPE; Brazil MMA). While multiple policies contributed, near‑real‑time monitoring underpinned rapid response.
- Indonesia’s sustained gains: According to Global Forest Watch, Indonesia’s annual primary forest loss remains roughly 64% below the 2016 peak, due to moratoria, concessions review, peatland protection, and satellite‑enabled oversight.
- Cost/benefit: Open satellite data (Landsat, Sentinel) are free; national systems require data processing and enforcement budgets. A 2020 NASA study estimated free Landsat data creates ~$3.45 billion in annual global economic benefits through applications like forestry and water management.
For practical habitat protection strategies that pair tech with on‑the‑ground stewardship, see Protecting Wildlife Habitats: A Practical Guide (/sustainability-policy/protecting-wildlife-habitats-guide-conservation-technology-action).
Pollution tracking and clean‑air action
- Hyperlocal mapping: A UC Berkeley/EDF study used mobile labs on Google Street View cars to map NO2, black carbon, and methane at 30‑meter scales in Oakland, finding 5–8× pollution differences between adjacent city blocks (PNAS, 2017). Such data informed targeted truck routing, filtration, and enforcement plans.
- Low‑cost sensor networks: Cities deploy $200–$2,000 particulate sensors (e.g., PurpleAir‑class) alongside a few reference‑grade monitors for calibration. Studies show strong correlations after bias correction, enabling school‑level alerts and micro‑zoning interventions at a fraction of traditional network costs (U.S. EPA Air Sensor Toolbox).
- Cost/benefit: Dense networks can be deployed for tens of thousands of dollars citywide versus millions for an equivalent number of reference stations; benefits include reduced healthcare costs via targeted mitigation.
![Atmotube Battery Powered Pro Portable Outdoor and Indoor Professional Air Quality Monitor [PM, VOCs, Temperature, Humidity and Barometric Pressure Tester], Pollution Meter : Industrial & Scientific](https://m.media-amazon.com/images/I/61d5vPuZOGL.jpg)
Atmotube Battery Powered Pro Portable Outdoor and Indoor Professional Air Quality Monitor [PM, VOCs, Temperature, Humidity and Barometric Pressure Tester], Pollution Meter : Industrial & Scientific
View on AmazonWildlife protection and anti‑poaching
- SMART and patrol optimization: The Spatial Monitoring and Reporting Tool (SMART) is now used in 1,200+ sites across 85+ countries (SMART Partnership). By standardizing data and feeding analytics back to rangers, multiple sites report increased patrol coverage and higher detection rates of illegal activity. Game‑theoretic patrol planning (e.g., PAWS from USC’s TEAMCORE lab) has shown up to ~30% increases in snare discoveries versus baseline patrol patterns in field trials.
- Integrated situational awareness: Platforms like EarthRanger fuse ranger GPS, camera traps, and aircraft feeds for real‑time operations. Managers report faster response times and improved coordination, contributing to declines in incursions in several African reserves.
- Cost/benefit: Software is often free or subsidized for conservation; major costs are training, connectivity, and ranger retention. Gains include fewer wildlife losses and better officer safety.
Precision agriculture and water stewardship
- Variable‑rate inputs: Soil moisture probes, weather stations, and satellite NDVI indices guide irrigation and fertilization. USDA and FAO case studies report typical 20–30% water savings from precision irrigation and 10–30% reductions in nitrogen application with maintained or 5–10% higher yields, cutting nitrous oxide emissions and runoff.
- Edge advisories: On‑farm decision support systems reduce diesel passes and pesticide use via targeted spraying.
- Cost/benefit: Payback can be 1–3 seasons for high‑value crops; for smallholders, shared services and SMS advisories reduce upfront costs.
Disaster early warning and response
- Flood and storm tracking: SAR satellites (Sentinel‑1) map floods through clouds within hours; agencies combined this with digital elevation models during 2022 Pakistan floods to guide evacuations and aid routing. NOAA and WMO integrate multi‑hazard data for cyclone early warnings.
- Benefits: The Global Facility for Disaster Reduction and Recovery (GFDRR) estimates that effective early warning systems can reduce disaster losses by up to 30%, with benefit‑cost ratios often exceeding 1:10. Timely maps speed relief and reduce secondary environmental harms (e.g., sewage overflows, chemical releases).
Practical considerations for deployment and scaling
Data collection, integration, and governance
- Start with the decision: Define what management action the data will trigger (e.g., close a road, issue a fine, dispatch a team). Collect only what’s needed.
- Interoperability: Use open geospatial standards (OGC WMS/WFS, GeoTIFF, SensorThings API), open schemas (GeoJSON), and message protocols (MQTT) so sensors, apps, and dashboards interconnect.
- Data pipelines: Pair cloud processing (e.g., scalable classification) with edge filtering to reduce bandwidth and protect privacy. Maintain metadata, provenance, and quality flags. Apply the FAIR principles (Findable, Accessible, Interoperable, Reusable) and the CARE principles for Indigenous Data Governance.
Partnerships across sectors
- Public agencies supply authority and continuity; NGOs contribute field expertise; academia brings methods; startups provide tools; communities add context and legitimacy. Clarify roles via MOUs and data‑sharing agreements. Co‑design with end users to ensure adoption.
Capacity, budgets, and total cost of ownership
- Plan for operations and maintenance: spares, calibration, connectivity, cybersecurity, and training. Budget at least 15–25% of capex annually for O&M on sensor networks; more in harsh environments.
- Build local capacity: Train rangers, inspectors, and community stewards to interpret data, not just collect it. Establish simple SOPs for triage and escalation.
Responsible deployment and social license
- FPIC and local consent: Obtain Free, Prior, and Informed Consent where indigenous or local communities are affected. Share benefits and data in accessible formats; avoid extractive monitoring.
- Security and safety: Protect sensitive locations (e.g., rhino GPS) with access controls; implement threat modeling for anti‑poaching tech to avoid tipping off offenders.
By the numbers
- 10 m, every ~5 days: ESA Sentinel‑2 optical revisit for global land imaging; all‑weather Sentinel‑1 radar for flood and forest monitoring.
- ~$3.45B/year: Estimated global economic benefit from free Landsat data (NASA).
- 1,200+: Protected areas using SMART for patrol management across 85+ countries (SMART Partnership).
- 70,000+: Industrial fishing vessels publicly tracked by Global Fishing Watch.
- 20–30%: Typical irrigation water savings from precision systems (USDA/FAO case studies).
- Up to 30%: Increase in illegal activity detections from optimized patrol planning (PAWS field trials).
- 1:10+: Typical benefit‑cost ratio for disaster early warning systems (GFDRR).
- 510 GW: Record renewable capacity additions in 2023, ~50% growth year‑over‑year (IEA).
- 620 to ~1,000 TWh: IEA projects data center, AI, and crypto electricity demand could rise from ~620 TWh (2023) to ~1,000 TWh by 2026.
Challenges and risks—and how to mitigate them
Data quality, bias, and validation
- Risks: Cloud cover, algorithm misclassifications, low sensor accuracy, and unrepresentative training data can skew results—especially in under‑sampled regions.
- Mitigations: Use ensemble methods and uncertainty quantification; calibrate low‑cost sensors against reference stations; run ground‑truth campaigns; publish model cards and error analyses.
Privacy, ethics, and legal constraints
- Risks: Drones over communities, camera traps capturing people, and location data on sensitive species raise privacy and safety issues.
- Mitigations: Minimize personally identifiable information; process on device when feasible; apply differential privacy or aggregation; follow local UAV and data‑protection laws; adopt FPIC and data sovereignty frameworks.
Energy and materials footprint
- Risks: Data centers and AI workloads consume rising electricity; hardware manufacturing has embedded carbon; e‑waste is a hazard.
- Mitigations: Favor efficient models (e.g., TinyML), edge inference, and renewable‑powered infrastructure; procure repairable, modular devices; set e‑waste take‑back and responsible recycling; schedule compute to align with low‑carbon grid hours. The IEA projects data center and AI electricity use could approach 1,000 TWh by 2026—energy sourcing matters.
Maintenance, funding continuity, and institutional uptake
- Risks: Sensor drift, vandalism, staff turnover, and funding cliffs can collapse programs.
- Mitigations: Design for simplicity; stock spares; train multiple champions; embed tools into official SOPs and budgets; use multi‑year agreements and results‑based funding where possible.
Emerging trends, enabling policies, and scalable business models
Trends to watch
- AI at the edge: Low‑power models on cameras, buoys, and collars enable on‑device species detection, illegal‑net recognition, or methane leak triage with reduced bandwidth and privacy risk.
- Methane and carbon monitoring from space: New sensors (e.g., MethaneSAT, Carbon Mapper) improve facility‑level attribution, accelerating compliance and voluntary abatement.
- Bioacoustics and eDNA: Dense acoustic arrays and environmental DNA unlock cost‑effective biodiversity monitoring for cryptic species and nocturnal activity.
- Satellite IoT and long‑range networks: Cheaper satellite backhaul extends sensor coverage to remote rangelands, peatlands, and high seas.
- Digital twins: Coupled models of watersheds, forests, and cities allow scenario testing (“what if we restore 5,000 ha of mangroves?”) before investments are made.
Enabling policies and standards
- Open data mandates: Free access to Landsat and Copernicus imagery underpins most monitoring systems; maintaining open archives multiplies benefits.
- Regulatory drivers: The EU Deforestation Regulation requires geo‑traceability for key commodities; U.S. EPA methane rules (2023) expand leak detection and repair. Clear standards create markets for monitoring and verification.
- Data and AI governance: Privacy laws (GDPR and analogs) and emerging AI regulations (e.g., EU AI Act) require risk management, transparency, and human oversight for high‑risk applications.
- Interoperability: Adoption of OGC standards, unique IDs for facilities and farms, and open taxonomies for species and habitats reduce integration friction across programs and borders.
Financing and business models
- Results‑based finance: Pay for verified outcomes (e.g., hectares of avoided deforestation, tons of methane abated) using transparent MRV built on satellites and sensors.
- Blended finance: Concessionary capital de‑risks early deployments; commercial capital scales proven models.
- Community‑led monitoring: Funding indigenous ranger programs and local data stewardship increases effectiveness and equity; evidence shows tenure security and local enforcement reduce deforestation rates.
- Public procurement and open‑source: Governments can anchor demand for environmental tech while supporting open tools that NGOs and communities can adopt.
Practical implications: how different actors can act now
- Policymakers: Mandate open environmental data; fund national monitoring backbones (satellite analytics, sensor calibration labs); align enforcement SOPs with near‑real‑time alerts; set privacy and AI guardrails.
- Businesses: Map supply chains to the farm and facility; deploy continuous emissions monitoring for methane and VOCs; pair low‑cost sensors with third‑party audits; use satellite‑verified MRV for sustainability claims.
- NGOs and communities: Co‑design monitoring with local stakeholders; prioritize simple, maintainable tools; publish methodologies and accuracy; invest in training and shared governance of data.
- Researchers and startups: Focus on uncertainty quantification, edge AI, and validated benchmarks; partner with implementers early to shorten the research‑to‑impact gap.
Using technology for environmental protection is most effective when it’s not just high‑tech, but high‑trust: open methods, shared governance, clear accountability, and sustained funding. The tools are ready; the challenge is scaling them responsibly to deliver cleaner air and water, protected wildlife, climate resilience, and measurable benefits for communities who depend on healthy ecosystems.
Recommended Products
Remote Sensing and GIS for Ecologists: Using Open Source Software (Data in the Wild)
Amazon.com: Remote Sensing and GIS for Ecologists: Using Open Source Software (Data in the Wild): 9781784270223: Wegmann, Martin, Leutner, Benjamin, Dech, Stefan: Books
Atmotube Battery Powered Pro Portable Outdoor and Indoor Professional Air Quality Monitor [PM, VOCs, Temperature, Humidity and Barometric Pressure Tester], Pollution Meter : Industrial & Scientific
We <strong>combine lab-tested sensing technology with intelligent software that transforms real-time air quality data into clear, actionable decisions</strong>. ... Used by leading institutions for fi
EF ECOFLOW Solar Generator DELTA 2 with 220W Solar Panel, 1024Wh LFP(LiFePO4) Battery, 1800W AC/100W USB-C Output, Fast Charging Portable Power Station for Home Backup Power, Camping & RVs : Patio, Lawn & Garden
Clean, Green Charging. With up to 500W of solar panel input, DELTA 2 is a solar generator that can be charged while camping, on an RV trip or off-grid. <strong>Includes a 220W Bifacial solar panel to
More in Sustainability Policy
- How Technology Aids Conservation: Sensors, AI, and Renewable Solutions
- How Technology Is Transforming Conservation: Tools, Impacts, and Responsible Deployment
- AI for Environmental Monitoring: Methods, Use Cases & Tools
- Using AI for Habitat Conservation: Practical Applications, Data Needs, and Ethical Implementation