How to Calculate Solar Panel Needs: Step-by-Step Guide & Examples

Solar is scaling fast—global additions topped 420 GW in 2023, a new record according to the International Energy Agency (IEA)—but the most common question remains basic: how to calculate solar panel needs for a home or small business. This guide walks you through a data-driven, five‑step method using your bills, local sun data, realistic system losses, and simple formulas. We’ll finish with worked examples (full offset, partial offset, and off‑grid with batteries), plus costs, payback, and next steps.
Why this matters: Right-sizing a system prevents overspending, avoids underperformance, fits your available roof area, and sets realistic expectations about bill savings and payback. The average U.S. household uses around 10,500 kWh per year (U.S. EIA, 2023); turning that into the right mix of kW, panel count, and layout is straightforward once you know the steps.
By the Numbers: Quick Reference
- Average U.S. home electricity use: ~10,500 kWh/year (EIA, 2023)
- Typical residential module nameplate: 380–440 W in 2026; physical area ~1.8–2.1 m² (19–23 ft²)
- Peak sun hours (PSH) examples: Phoenix ~6.5; Los Angeles ~5.5; Dallas ~5.0; New York City ~4.0; Seattle ~3.5 (NREL-based climatology)
- Common system losses (NREL PV industry benchmarks): 14–25% combined (inverter, wiring, temperature, soiling, mismatch, shading)
- Rule-of-thumb roof area per 1 kWdc: ~50–80 ft² depending on panel efficiency and layout
How to Calculate Solar Panel Needs: The Five-Step Method
Solar Electricity Handbook - 2023 Edition: A simple, practical guide to solar energy – designing and installing solar photovoltaic systems: Boxwell, Michael
Solar Electricity Handbook - 2023 Edition: <strong>A simple, practical guide to solar energy – designing and installing solar photovoltaic systems</strong> [Boxwell, Michael] on Amazon.com. *FREE* shi
Check Price on AmazonStep 1 — Determine your energy use: read bills and convert to kWh/day
- Gather 12 months of electric bills. Use total kWh, not just cost, to capture seasonal swings (HVAC loads, heating, EV charging, etc.). The EIA notes U.S. homes average ~10,500 kWh/year, but local climate and lifestyle vary widely.
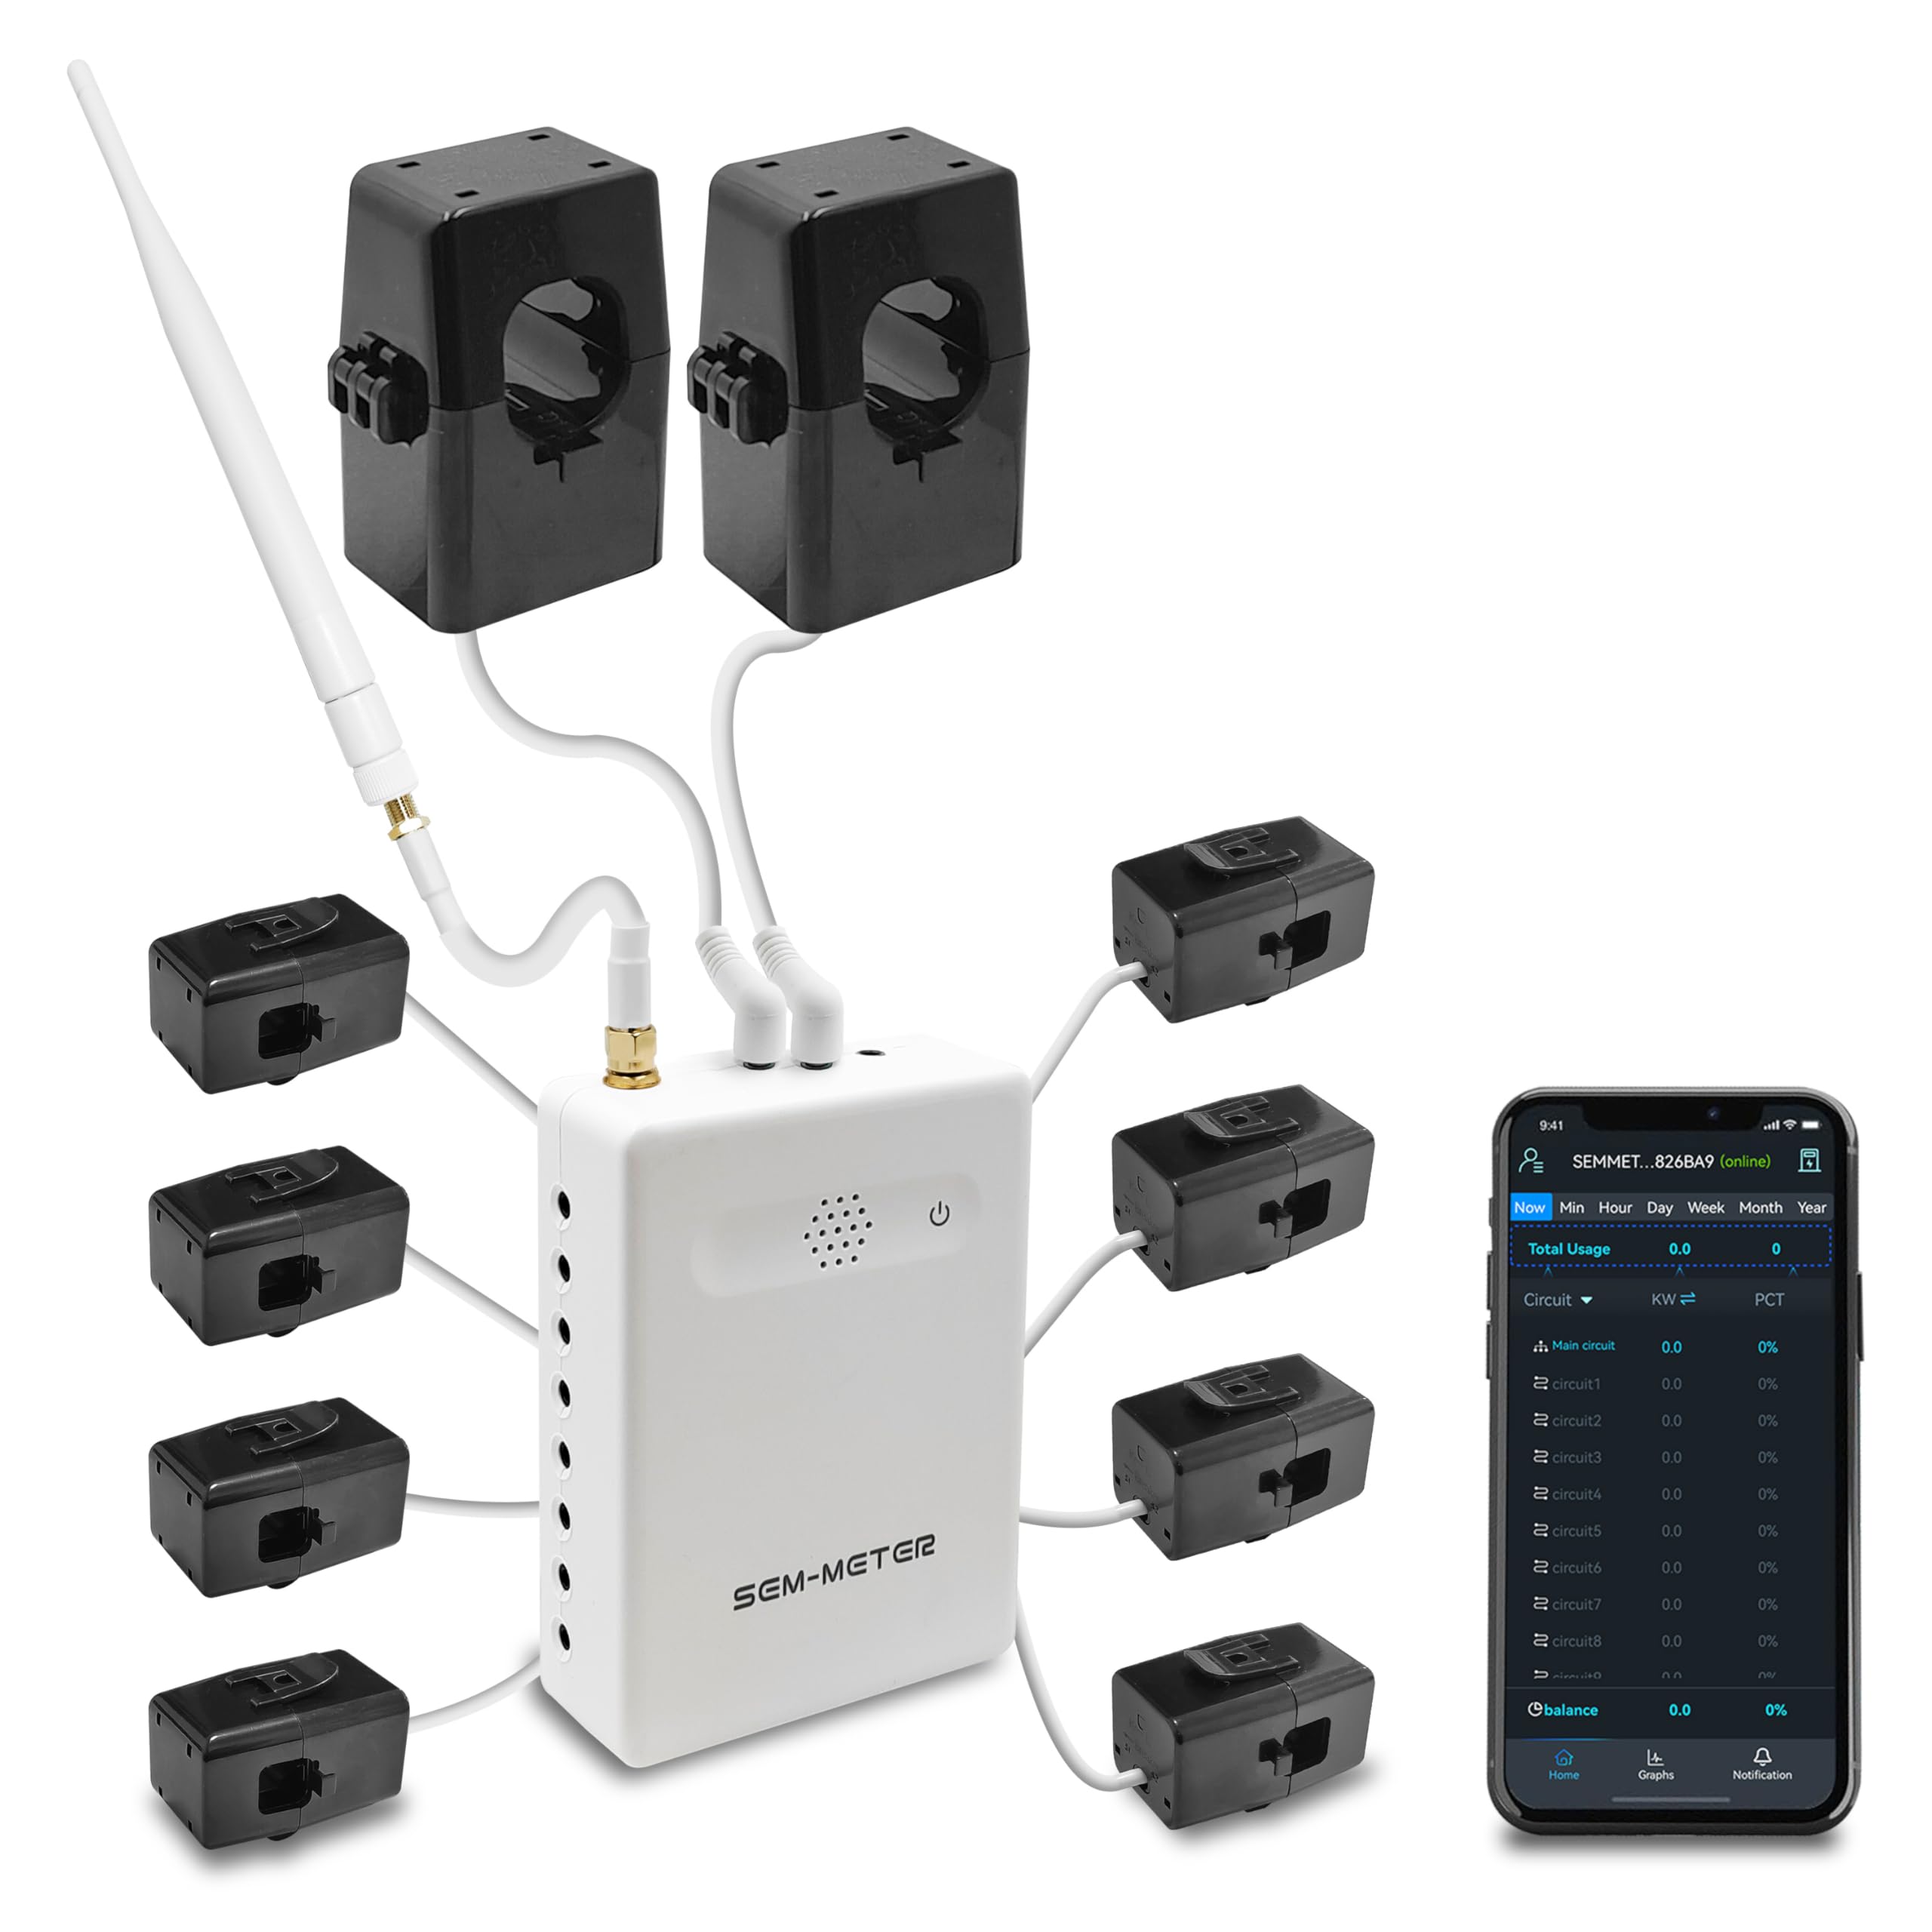
Smart Home Energy Monitor with 8 50A Circuit Level Sensors | Vue - Real Time Electricity Monitor/Meter | Solar/Net Metering - Amazon.com
View on Amazon- Compute your average daily consumption:
- Annual method: daily kWh = (annual kWh) ÷ 365
- Monthly method: daily kWh = (monthly kWh) ÷ (days in billing cycle)
- Adjust for planned changes:
- Electrifying heating or adding an EV? Add expected kWh. Example EV: 12,000 miles/year ÷ 3.5 mi/kWh ≈ 3,430 kWh/year (~9.4 kWh/day).
- Efficiency upgrades (heat pump water heater, air sealing) can reduce loads 10–30% depending on the measure (DOE studies).
Document two numbers:
- Baseline daily use (kWh/day)
- Target coverage (% of load you want solar to offset), e.g., 100% for net annual offset or 50–70% if you have limited roof space or time-of-use rates
Step 2 — Find your local solar resource: peak sun hours and insolation
Peak sun hours (PSH) is the average daily solar energy received expressed as equivalent hours at 1,000 W/m². It collapses weather, sun angle, and day length into a single, practical figure for sizing.
How to get PSH:
- Use reputable databases such as the National Renewable Energy Laboratory’s (NREL) PVWatts or typical meteorological year datasets (TMY). Enter your location and tilt/azimuth to get annual and monthly PSH.
- If you can’t run a model yet, use regional benchmarks from utility or state energy offices. Examples for fixed-tilt arrays near roof pitch:
- Southwest deserts: 5.5–7.5 PSH
- U.S. West Coast: 4.5–5.8 PSH
- U.S. Northeast/Midwest: 3.5–4.7 PSH
- U.K./Northern Europe: ~2.5–3.5 PSH
Important: If you have significant winter heating loads or are off‑grid, use the worst-month PSH to avoid seasonal shortfalls.
Step 3 — Account for system losses and derating (inverter, wiring, shading)
Panel nameplate ratings are at Standard Test Conditions (STC). Real-world performance is lower due to combined losses. NREL and field studies suggest typical residential total losses of 14–25%, depending on climate and design.
Common components of loss:
- Inverter efficiency: 2–5% loss (96–98% efficient inverters)
- DC wiring and connections: 1–3%
- Module mismatch: ~2%
- Temperature: 5–10% (hot roofs increase cell temperature and reduce voltage)
- Soiling: 2–5% (more in dusty or pollen-heavy areas)
- Shading: 0–15%+ depending on trees, chimneys; module-level power electronics mitigate but don’t eliminate
- Degradation: ~0.3–0.6%/year long-term (warranty-backed)
We summarize these with a single “system efficiency” factor. Example assumptions:
- Low-loss roof with module-level optimizers: total loss 14% → efficiency 0.86
- Typical suburban roof: total loss 18% → efficiency 0.82
- Partially shaded or very hot climate: total loss 22% → efficiency 0.78
Note on DC/AC ratio: Residential systems commonly oversize the DC array relative to the inverter (DC/AC ratio 1.1–1.3) to maximize energy harvest. This is already captured implicitly when you use PVWatts or a total-loss efficiency factor. If hand‑calculating, stay consistent about whether you size to DC nameplate (kWdc) or inverter AC (kWac).
Step 4 — Calculate required system size (kW) from energy and sun
Core formula (sizing to DC nameplate):
System size (kWdc) = Daily load (kWh/day) ÷ [PSH (h/day) × System efficiency]
- Daily load: from Step 1
- PSH: from Step 2 (annual average for grid-tied; worst month for off‑grid or winter-critical loads)
- System efficiency: from Step 3
Example: 30 kWh/day, PSH 5.0, efficiency 0.86 → 30 ÷ (5 × 0.86) ≈ 6.98 kWdc.
Translate system size to annual production:
Annual kWh ≈ kWdc × PSH × 365 × System efficiency
This is a simplified but surprisingly accurate check when compared to PVWatts or utility interconnection studies.
Step 5 — Convert kW to panel count, roof/ground area, and layout tips
- Panel count:

Klein Tools 935DAG Digital Electronic Level and Angle ...
View on AmazonNumber of panels = System size (Wdc) ÷ Panel wattage (W)
- If using 400 W panels: panels = kWdc × 1,000 ÷ 400
- Round up to the nearest whole panel; installers will often adjust the stringing/layout and inverter size accordingly
- Roof or ground area:
- A modern 400 W panel is ~21–23 ft². For a quick estimate: area (ft²) ≈ panels × 22 ft²
- Allow extra for fire code setbacks, roof edges, hips/valleys, vents, and walkways. Net usable area can be 70–85% of gross roof plane area.
- Ground mounts require clear spacing between rows to avoid self‑shading at low sun angles; site plans often add 20–40% to the array footprint.
- Layout and orientation:
- Azimuth: Due south (180° in the Northern Hemisphere) maximizes annual kWh. East/West roofs typically produce ~10–15% less but often shine for time‑of‑use rates by spreading generation across morning/afternoon.
- Tilt: Equal to local latitude maximizes annual yield; following roof pitch (15–30° common) is fine for simplicity and cost.
- Shading: Use a shade analysis tool (e.g., SunEye or lidar-based apps). Even 10% annual shading can materially impact kWh; consider module-level power electronics.
Choosing panel wattage and efficiency:
- Higher‑wattage, higher‑efficiency modules reduce panel count and area, helpful on space‑constrained roofs. See our guide to the Most Efficient Solar Panels in 2026: Top Technologies & Best Models for context on current efficiencies and tradeoffs.
Worked Examples: Full Offset, Partial Offset, Off‑Grid with Storage
Example A — Grid‑tied home aiming for 100% offset
- Location: Dallas, Texas (annual PSH ≈ 5.0 for a south‑facing roof near 25° tilt)
- Annual consumption: 11,000 kWh → daily = 30.1 kWh/day
- System losses: 14% total (efficiency 0.86) with module‑level optimizers
Sizing:
- kWdc = 30.1 ÷ (5.0 × 0.86) = 7.02 kWdc
- Panels (400 W): 7,020 W ÷ 400 ≈ 17.6 → 18 panels
- Area: 18 × 22 ft² ≈ 396 ft² net; plan ~450–500 ft² with setbacks and obstructions
- Expected annual kWh: 7.02 × 5.0 × 365 × 0.86 ≈ 11,000 kWh (close to 100% offset)
Reality checks:
- East/West roofs may yield ~10% less; 18 panels might offset ~90% instead.
- Higher summer output can exceed midday home use; check net metering/export credit rules.
Example B — Partial offset due to limited roof space
- Location: New Jersey (annual PSH ≈ 4.2)
- Annual consumption: 9,000 kWh → 24.7 kWh/day
- Target coverage: 60% (roof constraints)
- System losses: 16% (efficiency 0.84)
Sizing for 60% of load:
- Target daily solar kWh = 24.7 × 0.60 = 14.8
- kWdc = 14.8 ÷ (4.2 × 0.84) = 4.19 kWdc
- Panels (400 W): 4,190 ÷ 400 ≈ 10.5 → 11 panels (44 ft × 10 ft plane likely sufficient)
What if the roof only fits 10 panels?
- 10 × 400 W = 4.0 kWdc
- Expected annual kWh = 4.0 × 4.2 × 365 × 0.84 ≈ 5,150 kWh
- Coverage = 5,150 ÷ 9,000 ≈ 57% of annual load
Pro tip: If you have time‑of‑use rates, an East‑West split can boost late‑afternoon production, increasing bill savings per kWh even at slightly lower total kWh.
Example C — Off‑grid cabin with battery storage
- Location: Western Montana; design for winter (worst‑month PSH ≈ 3.0 at optimal tilt)
- Daily load: 8 kWh (LED lights, efficient fridge, laptop, small well pump; limited winter heating)
- System losses: 20% (efficiency 0.80) due to colder temps, snow/soiling, and conservative assumptions
- Days of autonomy: 2 (acceptable generator backup beyond that)
- Battery: Lithium iron phosphate (LiFePO4), usable DoD 80%, round‑trip efficiency ~90%
Array size (winter‑critical):
- kWdc = 8 ÷ (3.0 × 0.80) = 3.33 kWdc (round to ~3.4–3.6 kWdc)
- Panels (400 W): ~9 panels (3.6 kWdc)
Battery sizing:
- Usable energy required = 8 kWh/day × 2 days = 16 kWh
- Nominal capacity = Usable ÷ (DoD × round‑trip eff) = 16 ÷ (0.80 × 0.90) ≈ 22.2 kWh
- Practical bank: 20–24 kWh at 48 V, paired with a 4–6 kW inverter/charger, plus generator input for prolonged storms
Seasonal nuance: Summer PSH may double; consider a tilt‑adjustable ground mount to boost winter capture and shed snow. A 10–20% portable or generator backup margin is common for off‑grid reliability.
Practical Factors That Change the Math
- Roof age and structure: Re‑roofing before solar avoids future removal/reinstall costs; structural limits can cap array size.
- Shading and soiling: Trees, chimneys, and dust reduce yield—quantify with shade analysis rather than guessing.
- Net metering/export policy: Full retail credit vs. avoided‑cost rates changes optimal system size. In export‑limited markets, undersizing slightly can improve ROI.
- Module selection: Higher efficiency reduces panel count and can help meet 100% offset on tight roofs.
- Degradation: Expect ~0.3–0.6%/year. Long warranties (25–30 years) now guarantee 80–90% of initial output at term.
For a deeper starter overview, see Solar Panels for Beginners: A Practical, Data-Driven Guide. If you want a quick estimator and rules of thumb, check How Many Solar Panels Do I Need? A Practical Guide & Estimate.
Costs, Payback, Incentives, and Next Steps
What systems cost in 2026
- Benchmarks: NREL’s recent residential cost benchmarks are in the ~$2.70–$3.10/Wdc range before incentives for typical rooftop systems, with regional variation. Installer quotes in 2026 commonly span ~$2.50–$3.50/Wdc depending on equipment, roof complexity, and market conditions.
- Example 7.0 kWdc system at $2.75/W: $19,250 gross cost
- Federal incentive (U.S.): 30% Investment Tax Credit (ITC) available through at least 2032 under the IRA → net ~$13,475, plus potential state/utility rebates
Use our pricing deep dives for context on drivers and savings:
- How Much Do Solar Panels Cost in 2026? Average Prices & Savings
- Solar Panel Cost Guide: How Much You’ll Pay & How to Save
Estimating payback and savings
Simple payback (years) ≈ Net upfront cost ÷ First‑year bill savings
Continuing the 7.0 kW example (Dallas‑like PSH 5.0; 14% losses):
- First‑year production ≈ 7.0 × 5.0 × 365 × 0.86 ≈ 11,000 kWh
- At $0.16/kWh average utility rate → ~$1,760/year savings
- Payback ≈ $13,475 ÷ $1,760 ≈ 7.7 years
Notes:
- Time‑of‑use/export tariffs can raise or lower savings; self‑consumption proportion matters.
- Degradation slightly reduces annual kWh; utility rates often rise over time, offsetting degradation.
- Batteries increase resilience but usually extend payback unless you capture demand charge reductions or peak arbitrage.
For a savings‑first walkthrough, see How Much Can Solar Panels Save You? Real Costs, Savings & Payback.
Permitting, interconnection, and installer checklist
- Permitting: Your Authority Having Jurisdiction (AHJ) will require electrical and often structural review; many U.S. jurisdictions now streamline via SolarAPP+ or similar.
- Interconnection: Submit utility applications early; understand meter upgrades, export limits, and any required production meters.
- Codes & standards: NEC 690 compliance and rooftop fire setbacks; equipment should carry UL/IEC certifications.
- Site readiness: Roof age, rafter layout, conduit paths, and main panel capacity (bus rating, solar ready) influence cost and feasibility.
Installer checklist:
- Credentials: NABCEP-certified designers/crew; licensed electrical contractor
- Design docs: Shade analysis, production estimate with monthly kWh, stringing/MLPE plan, and DC/AC ratio
- Warranties: Module (25–30 yr performance), inverter (10–25 yr), workmanship (10+ yr); clear roof penetrations warranty if applicable
- Monitoring: Per‑module or string‑level monitoring included; data access and alerting
- Financials: Transparent price per watt, change‑order policy, and incentive paperwork support
Putting It All Together: A Short Sizing Recipe
- Gather 12 months of kWh; compute daily average and pick a target coverage %.
- Look up PSH for your location and array tilt/azimuth; use annual PSH for grid‑tied, worst month for off‑grid.
- Choose a realistic system efficiency (0.78–0.86 typical) based on shading, climate, and equipment.
- Compute kWdc = Daily kWh ÷ (PSH × Efficiency).
- Pick a panel wattage (e.g., 400 W) and divide to get panel count; check roof area and adjust layout.
- Verify with a modeling tool and refine assumptions.
If you’re comparing options or optimizing for space, our guide to How Many Solar Panels Do I Need? A Practical Guide & Estimate walks through quick calculators and constraints.
Where this is heading
Module efficiencies keep creeping up (lab‑to‑market advances in TOPCon and heterojunction), inverters are increasingly 97–99% efficient, and better shade‑tolerant electronics narrow real‑world losses. At the same time, policy shifts—net billing, time‑variant rates—mean the “right” system size is not always the biggest. Expect sizing to favor self‑consumption shapes (east/west arrays, smart controls, modest batteries) with designs tailored to tariffs and occupant behavior. The method above—energy first, local sun, honest losses—remains the best way to right‑size for cost, carbon, and comfort.
Recommended Products
Solar Electricity Handbook - 2023 Edition: A simple, practical guide to solar energy – designing and installing solar photovoltaic systems: Boxwell, Michael
Solar Electricity Handbook - 2023 Edition: <strong>A simple, practical guide to solar energy – designing and installing solar photovoltaic systems</strong> [Boxwell, Michael] on Amazon.com. *FREE* shi
Smart Home Energy Monitor with 8 50A Circuit Level Sensors | Vue - Real Time Electricity Monitor/Meter | Solar/Net Metering - Amazon.com
Lightweight commercial 3-phase option available as a separate bundle. APPLICATION MONITORING WITHOUT GUISEWORK <strong>Up to sixteen (16) 50A sensors to accurately monitor your air conditioner, oven,
Klein Tools 935DAG Digital Electronic Level and Angle ...
Rely on Klein Tools' premium-grade hand tools built to stand up to the demands of the job. Discover a diverse selection of electrical and measurement solutions.